비접촉식 적외선 센서를 이용한 복합레진 광중합 시 온도 변화의 실시간 분석
초록
본 연구의 목적은 비접촉식 적외선 센서를 이용하여 복합레진 광중합시 광 조사기의 radiant emittance 변화에 따른 온도 변화를 분석하는 것이다. 비접촉식 적외선 센서와 마이크로컨트롤러를 이용하여 온도 측정 장치를 제작하였다. 디스크 형태의 미세혼합형(Z250) 또는 나노 벌크필(BFP) 복합레진 시편을 준비한 후, 펄스 폭 변조 LED 광 조사기를 이용하여 세 가지 다른 광 조사 방법(Duty ratio/조사 시간; 100%/20 s, 50%/40 s, Increase (0→100%)/40 s)을 적용하면서 복합레진 광중합 시 온도 변화를 측정하였다. 이어서 광중합 된 복합레진 시편에 첫 번째와 같은 방법으로 두 번째 광 조사를 시행하였다. 실시간 온도 변화 곡선의 첫 번째 최고점로부터 총 최대 온도 상승(ΔTtotal), 두 번째 최고점으로부터 광 조사기의 복사열에 의한 최대 온도 상승(ΔTlight)을 얻었다. 복합레진 중합열에 의한 최대 온도 상승(ΔTcomposite)은 첫 번째 광 조사를 시행했을 때 발생한 온도 변화 곡선에서 이미 중합 된 복합레진에 두 번째 광 조사를 시행했을 때 발생한 온도 변화 곡선을 차감한 곡선의 최대 온도 변화 값을 통해 구했으며, ΔTcomposite이 나타난 시간을 peak time으로 정의하였다. 두 종류의 복합레진 모두 ΔTtotal, ΔTcomposite은 100%/20 s 실험군에서 최대였고, ΔTlight는 50%/40 s 실험군에서 최소였다(p<0.05). Increase/40 s 실험군의 ΔTcomposite를 제외하고, 모든 실험군에서 Z250의 온도 상승은 BFP보다 높았다(p<0.05). 두 종류의 복합레진 모두 Increase/40 s group의 peak time이 가장 길었으며, BFP의 peak time은 모든 광 조사 조건에서 Z250보다 길었다(p<0.05). 비접촉식 적외선 센서를 이용한 복합레진의 광중합 시 온도 변화에 대한 실시간 분석은 효과적으로 이루어질 수 있었으며, 이를 통해 복합레진의 중합 역학도 평가할 수 있었다.
Abstract
The aim of this study was to investigate the effects of the radiant emittance of an LED light on temperature change during composite photopolymerization using a non-contact infrared sensor. A thermometer was prepared using a non-contact infrared sensor and a microcontroller. After preparing a disc-shaped composite specimen using a micro-hybrid conventional (Z250) or nano bulk-fill (BFP) composite, the temperature change of the prepared composite during photopolymerization was measured based on three photopolymerization protocols (Duty ratio/exposure time; 100%/20 s, 50%/40 s, and Increase (0→100%)/40 s) using a pulse width modulated (PWM) LED light. Subsequently, second light exposure, having the same protocol as the first, was performed on the photopolymerized composite. The first peak temperature rise of composite photopolymerization (ΔTtotal) and second peak temperature rise caused by the LED light (ΔTlight) were obtained from the temperature change vs. time curve. The net peak temperature rise caused by the curing heat of the composite (ΔTcomposite) was obtained by subtracting the second curve from the first one. The peak time was defined as the time when ΔTcomposite occurred. ΔTtotal and ΔTcomposite of the 100%/20 s group were the highest and ΔTlight of the 50%/40 s group was the lowest for both the composites (p<0.05). The temperature rise of Z250 was higher than that of BFP in all the groups except the ΔTcomposite of the Increase/40 s group (p<0.05). The peak time of the Increase/40 s group was the longest in both the composites, and the peak time of BFP was longer than that of Z250 in all the photopolymerization protocols (p<0.05). A real-time analysis of the temperature change during composite photopolymerization was effectively performed using the non-contact infrared sensor. Through this analysis, the polymerization kinetics of the composite could also be evaluated.
Keywords:
Non-contact infrared sensor, Temperature change, Composite resin, Photopolymerization, Radiant emittance키워드:
비접촉식 적외선 센서, 온도 변화, 복합레진, 광중합, 복사 발산도서 론
2019년 말에 최초로 보고된 이후 2022년 현재까지 전 세계적으로 대유행(pandemic) 양상을 보이고 있는 코로나바이러스감염증-19(COVID-19)는 다양한 임상 증상을 보이지만 발열이 가장 대표적인 증상으로 보고되었다(1). 그에 따라 코로나바이러스감염증-19 유증상자 선별을 위해 비접촉식 적외선 체온계를 이용한 발열 여부 검사가 널리 사용되고 있다(2). 이러한 비접촉식 체온계는 비접촉식 적외선 온도 센서(non-contact infrared temperature sensor)를 이용하여 측정 대상의 표면에서 방출되는 적외선을 감지하여 열을 전기적 신호로 변환해서 온도 변화에 대한 정보를 얻도록 해주는 장비이다(2).
한편, 복합레진의 광중합과정은 메타크릴레이트 계열 단량체에 존재하는 탄소-탄소 이중결합 부위에서 자유라디칼 부가 중합반응을 통해 이루어지며 발열반응에 속한다(3, 4). 또한 광중합시 사용되는 LED 광 조사기의 복사열도 온도 상승을 야기한다(5, 6). 따라서 복합레진을 수복하는 과정에서 발생하는 두 가지 종류의 열로 인해 온도가 상승하게 되는데 이는 치수 또는 치아주위조직의 손상을 야기할 가능성이 있으므로 이에 대한 주의가 필요하다(7-9). 복합레진의 광중합 동안 발생하는 온도 변화는 서미스터(thermistor), 열전대(thermocouple), 시차주사열량분석법(differential scanning calorimetry), 적외선 열화상 카메라(infrared thermal camera) 등을 이용하여 다양한 방법으로 연구되어 왔다(3, 4, 10-16). 서미스터 또는 열전대를 이용할 경우 시편과 직접 접촉시켜야 하는 단점이 있고, 시차주사열량계와 적외선 열화상 카메라의 경우 측정과정 및 장비가 복잡하여 단순히 온도 변화만을 측정하기에는 비효율적인 측면이 있다. 서두에서 언급했던 비접촉식 적외선 온도 센서를 이용하여 복합레진 광중합 시 온도 변화를 측정할 경우 비교적 간편하게 측정이 가능하며, 시편과 직접 접촉하지 않고 비침습적으로 측정이 가능하다. 그러나 비접촉식 적외선 센서를 이용하여 복합레진의 온도 변화를 분석한 연구는 전무하며, 교정용 브라켓을 부착할 때 사용하는 시멘트 적용 시 법랑질 표면의 온도 변화를 알아보는 연구에서 제한적으로만 사용된 바 있다(17).
복합레진 광중합 시 온도 변화를 분석한 이전 연구들에 따르면 광 출력 및 광 조사기 변화에 따라 온도 증가 패턴이 다름이 보고되었다(4, 11, 15, 16, 18). 본 연구에서는 마이크로컨트롤러를 이용하여 디지털 신호의 한 주기 안에서 켜지고 꺼지는 시간의 비율(duty ratio)의 변화를 통해 LED로 공급되는 전류를 조절하여 광 조사기의 출력(radiant emittance)을 변화시키는 펄스 폭 변조(pulse width modulation, PWM) 방식을 적용하여 자체 제작된 PWM-LED 광 조사기를 이용하였다(19). 이를 통해 총 광 에너지를 일정하게 유지하면서 광 조사기의 출력과 조사시간을 정밀하게 조절할 수 있었다. 또한 비접촉식 적외선 센서와 마이크로컨트롤러를 이용한 온도 측정 장치를 자체 제작하여 광 조사 방법 변화에 따른 복합레진 광중합 시 온도 변화를 실시간으로 분석해보고자 하였다. 실시간 분석의 경우 광중합 과정 중간에 일어나는 온도 변화에 대한 정보를 얻을 수 있어 중합 역학도 분석할 수 있다는 장점을 가진다.
귀무가설은 “첫째, 광 조사 방법 변화에 따라 복합레진 광중합 시 온도 변화의 차이가 없을 것이다. 둘째, 복합레진 종류에 따라 광중합 시 온도 변화의 차이가 없을 것이다.”로 설정하였다.
재료 및 방법
1. 재료
본 연구에서는 미세혼합형 복합레진 Z250 Universal Restorative (Z250; 3M ESPE, St. Paul, MN, USA) 및 나노 벌크필 복합레진 Bulk Fill Posterior Restorative (BFP; 3M ESPE)를 사용하였다. 각 복합레진의 조성은 Table 1과 같다.
2. 시편 준비
가로 80 mm, 세로 25 mm, 두께 1 mm 크기의 글라스 슬라이드 가운데에 복합레진 0.37 g을 위치시키고 같은 크기의 또 다른 글라스 슬라이드를 덮은 후 vise로 시편을 압착하였다. 이 때 두 글라스 슬라이드 양단 사이에 1 mm 두께의 글라스 슬라이드를 스페이서(spacer)로서 위치시켜 디스크 형태의 복합레진 시편(두께: 1 mm)을 얻었다. 시편은 각 실험군 당 3개씩 제작하였다.
3. 복합레진 광중합 시 온도 변화 측정
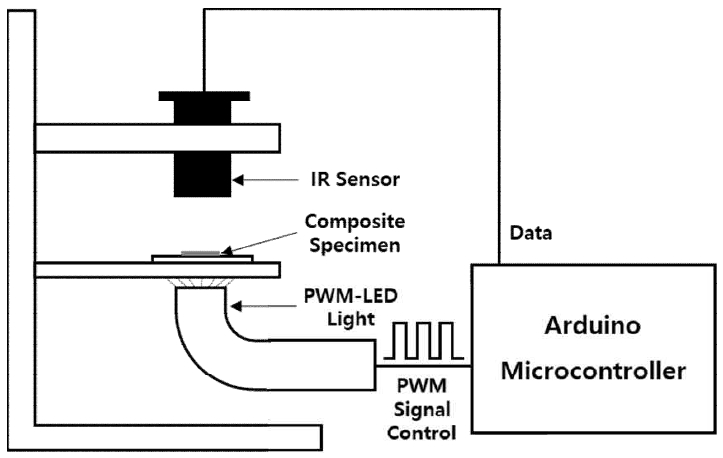
비접촉식 적외선 센서(DTS-L300-V2, Diwellshop, Gunpo, Korea; 측정 파장 대역: 5.5~14 µm, 측정 온도 범위: -20~70℃)와 마이크로컨트롤러(Arduino, Torino, Italy)를 이용하여 비접촉식 온도 측정 장치를 제작하였다(Figure 1).
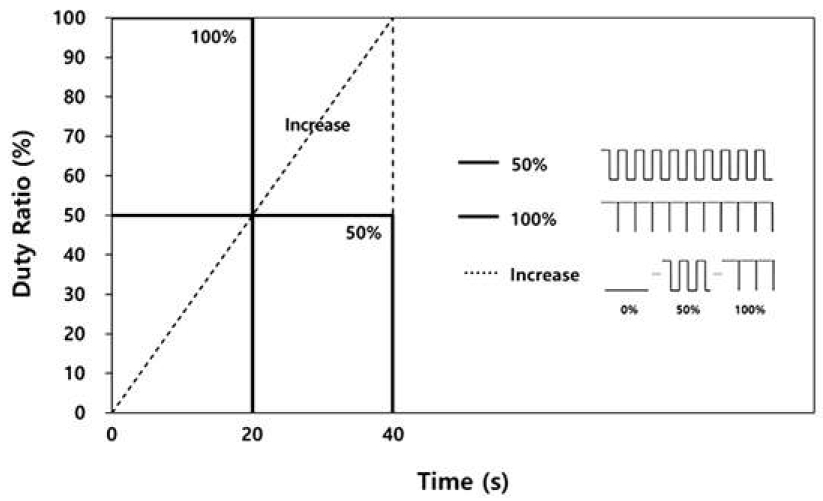
디스크 형태(직경: 15 mm, 두께: 1 mm)의 복합레진 시편이 준비된 글라스 슬라이드를 온도 측정 장치의 측정 위치에 올려놓고 PWM-LED 광 조사기(IB Systems, Seoul, Korea)를 이용하여 세 가지 다른 방법으로 광 조사를 시행하면서 온도 변화를 측정하였다. 비접촉식 적외선 센서와 시편 사이의 거리는 10 mm였고, 광 조사기와 시편 간의 거리는 3 mm였다. PWM-LED 광 조사기(IB Systems, Seoul, Korea)의 duty ratio, radiant emittance, 조사 시간, radiant exposure 변화의 세부사항은 Table 2와 같고 전체 광 에너지가 일정하게 유지되도록 duty ratio와 조사시간을 변화시켰다(Figure 2). 변화된 PWM-LED 광 조사기의 radiant emittance는 check-MARC curing light testing service (BlueLight Analytics Inc., Halifax, Canada)를 이용하여 측정하였다. 측정된 radiant emittance 값은 50% duty ratio 일 때 897 mW/cm2, 100% duty ratio 일 때 1,793 mW/cm2 였다(Table 2).

Diagram showing changing duty ratio and exposure time with constant total radiant exposure (product of duty ratio and exposure time).
Baseline data 10초를 얻은 후, 자동으로 광 조사기가 켜지도록 설정되었다. 광 조사 시작 후 첫 번째 온도 상승이 관찰되었으며, 온도 변화는 300초 동안 기록되었다(n=3). 이후 광중합 된 복합레진 시편에 두 번째 광 조사가 자동으로 시작되고 온도 변화가 300초 동안 기록된 후 610초에 자동으로 기록이 정지되었다. 시간에 따른 온도 변화 곡선으로부터 복합레진의 첫 번째 최대 온도 상승(복합레진의 중합열 및 광 조사기의 복사열에 의한 총 온도 상승, ΔTtotal) 및 두 번째 최대 온도 상승(광 조사기 복사열에 의한 온도 상승, ΔTlight)를 구하였다. 복합레진이 중합될 때 발생하는 열에 의한 최대 온도 상승(ΔTcomposite)은 첫 번째 온도 변화 곡선에서 두 번째 온도 변화 곡선을 차감하여 얻어진 곡선으로부터 구하였다. ΔTcomposite이 나타날 때의 시간을 peak time으로 정의하였다.
4. 통계분석
광 조사 방법 변화에 따른 비교를 위해 일원분산분석 및 사후검정(Tukey’s test) 시행하였으며, 두 종류의 복합레진 사이의 차이를 알아보기 위하여 t-test를 이용하였다. 분석은 SPSS software version 28.0(IBM, Armonk, NY, USA)를 이용하여 이루어졌으며, 검정을 위한 유의수준은 5%로 설정하였다.
결 과
1. 복합레진 광중합 시 온도 변화
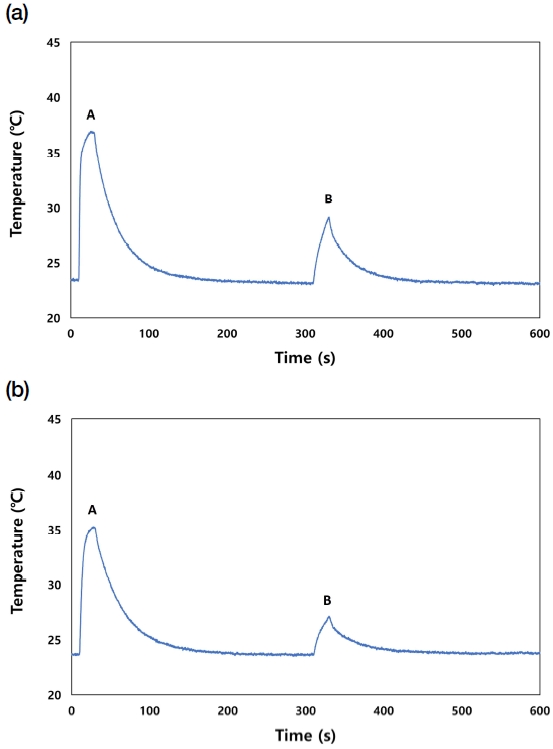
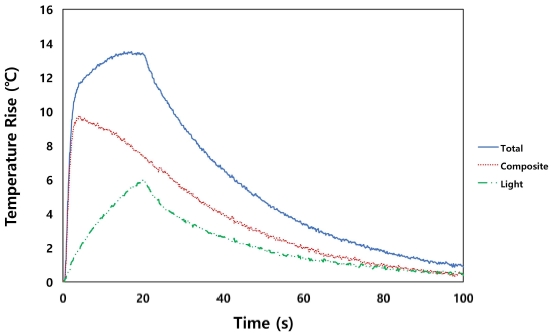
실시간으로 측정한 Z250과 BFP 복합레진의 광중합 시 온도 변화의 대표 곡선은 Figure 3과 같으며, 이 곡선으로부터 얻은 Z250 복합레진의 총 온도 상승, 광 조사기에 의한 온도 상승, 복합레진 중합열로 인한 온도 상승의 대표 곡선은 Figure 4에 나타냈다. ΔTtotal은 Z250과 BFP 모두 100%/20 s 실험군에서 최대였으나(p<0.05), Z250에서는 Increase/40 s 및 50%/40 s 실험군 사이에 유의한 차이가 관찰되지 않았고(p>0.05), BFP에서는 Increase/40 s 실험군이 50%/40 s 실험군보다 큰 값을 나타냈다(p<0.05). ΔTcomposite은 두 종류의 복합레진 모두 100%/20 s 실험군에서 최대였고(p<0.05), 나머지 두 실험군 사이에서는 유의한 차이를 나타내지 않았다(p>0.05). ΔTlight는 두 종류의 복합레진 모두 50%/40 s 실험군에서 최소였고(p<0.05), 나머지 두 실험군 사이에서는 유의한 차이를 나타내지 않았다(p>0.05). Increase/40 s 실험군의 ΔTcomposite을 제외한 모든 실험군에서 Z250의 온도 상승이 BFP보다 높았다(p<0.05). 세부 결과값은 Table 3-5에 제시하였다.

Representative curve of temperature as a function of time during photopolymerization of composite using the PWM-LED light with a 100% duty ratio and 20-s exposure time. (a) Z250 and (b) BFP (A: Total temperature change by heat from the first light exposure and composite polymerization, B: Temperature change only by the second successive light exposure on the polymerized composite).

Representative temperature rise curves of Z250 composite using the PWM-LED light with a 100% duty ratio and 20-s exposure time; total, by the LED light, and by curing heat of composite.

Maximum temperature rise by curing heat of composite (ΔTcomposite) with different photopolymerization protocols
2. 복합레진 광중합 시 중합 역학
Peak time은 Z250과 BFP 모두 Increase/40 s 실험군에서 최대였고, 50%/40 s 실험군, 100%/20 s 실험군 순서로 감소하였으며, BFP가 Z250보다 더 길었다(p<0.05; Table 6).
고 찰
본 연구에서는 비접촉식 적외선 온도 센서를 적용하여 자체 제작한 비접촉식 온도 측정 장치와 PWM-LED 광 조사기를 이용하여 광 조사 방법 변화에 따른 복합레진 광중합 시 온도 변화를 분석하였다. 총 최대 온도 상승(ΔTtotal), 광 조사기의 복사열에 의한 최대 온도 상승(ΔTtotal), 복합레진 중합열에 의한 최대 온도 상승(ΔTcomposite)을 구하였는 바, 각각의 온도 변화 곡선 및 최대 온도 상승값은 열전대(Thermocouple)를 이용하여 측정한 결과와 비교될 수 있는 수준이었다(11, 20).
복합레진의 중합열은 메타크릴레이트 계열 단량체의 탄소-탄소 간 이중결합이 단일결합으로 전환되면서 발생하므로 무기 필러의 비율이 적을수록 중합열이 증가한다(21). 본 연구에서 사용된 복합레진의 필러함량은 Z250 (82 wt%, 60 vol%)보다 BFP (76.5 wt%, 58.4 vol%)가 더 적으므로 상대적으로 BFP이 더 많은 레진 기질을 포함하여 더 많은 중합열을 발생시킬 것이다. 이러한 가설은 이전 연구에서 시차주사열량분석법(differential scanning calorimetry)을 이용하여 Z250, BFP의 중합열을 측정한 연구에서 검증된 바 있다(15). 그러나 본 연구에서 복합레진이 중합될 때 발생하는 열에 의한 최대 온도 상승(ΔTcomposite)은 100%/20 s 실험군과 50%/40 s 실험군에서는 BFP보다 Z250에서 더 컸으며, Increase/40 s 실험군에서는 두 복합레진 사이에 유의한 차이가 관찰되지 않았다. 이러한 결과는 BFP의 느린 중합속도 때문일 것이다. BFP에 포함된 나노 단위의 작은 필러 입자는 단량체와 필러 사이의 접촉 면적을 증가시키고 단량체와 자유라디칼의 움직임을 제한하여 중합속도를 감소시킬 수 있다(22, 23). 또한 복합레진의 중합속도는 광 개시제 또는 억제제의 농도(24), 단량체의 종류(25, 26)에 의해서도 변화할 수 있기 때문에 BFP와 Z250의 광 개시제나 단량체의 차이가 중합속도의 차이를 나타냈을 수 있다. BFP가 Z250에 비해 느린 중합속도를 나타낸다는 것은 이전 연구에서 이미 보고된 바 있고(19), 본 연구 결과 중 Z250보다 BFP에서 peak time이 유의하게 증가한 것을 통해서도 확인할 수 있었다(Table 6). 이렇게 감소된 중합속도로 인해 BFP에서는 중합열에 의한 온도 상승이 천천히 일어나게 되어 ΔTcomposite이 Z250에서 더 크게 나타났을 것으로 생각된다. 또한 복합레진의 열용량(heat capacity)도 온도 상승에 영향을 줄 수 있을 것이다.
Peak time은 복합레진 중합열에 의한 최대 온도 상승이 나타난 시간으로 정의하였기 때문에 이를 통해 복합레진의 겔화 시간을 예측해볼 수 있다. Peak time은 두 복합레진 모두 초기의 광 조사기의 radiant emittance가 감소할수록 증가했으며, 이는 자유라디칼 생성 속도 감소로 인한 중합반응 지연 때문일 것이다.
광 조사기의 출력이 증가하면 광 조사기에 의한 복사열과 복합레진의 중합열이 모두 증가한다(16). 광 조사기의 복사열에 의한 온도 상승인 ΔTlight은 두 복합레진 모두 100%/20 s 실험군과 Increase/40 s 실험군은 유사한 값을 보였는데(Figure 5), Increase/40 s 실험군의 경우 40 초 동안 PWM-LED 광 조사기의 duty ratio가 0에서 100%까지 연속적으로 증가(radiant emittance가 0에서 1,793 mW/cm2까지 연속적으로 증가)하므로 광 조사 후반부인 20~40 초 사이에는 높은 radiant emittance로 조사되므로 100%/20 s 실험군과 유사한 ΔTlight을 나타내게 되었을 것이다. 또한 ΔTlight은 BFP보다 Z250에서 더 높았는데(Table 5), 이는 중합 된 복합레진의 열확산도(thermal diffusivity)와 관련하여 설명될 수 있다. 열확산도는 열전도도(thermal conductivity)를 밀도(density)와 열용량(heat capacity)로 나눈 값으로 정의되므로 열전도도가 크고 열용량이 작을수록 큰 값을 보이게 된다(27). 이전 연구에 따르면 복합레진의 열확산계수는 0.151–0.636 mm2/s 범위의 값을 보이며, quartz 또는 silicon nitride/silica 성분의 필러가 포함된 복합레진에서 높았고 방사선불투과도를 높이는 barium 또는 strontium이 포함된 복합레진에서는 낮았다(28). 방사선불투과성 필러의 원자번호가 클수록 더욱 방사선불투과도가 높다고 알려져 있는데(29), BFP에는 barium (원자번호: 56), strontium (원자번호: 38)보다 원자번호가 큰 ytterbium (원자번호: 70) 필러가 포함되어 있어서 zirconia/silica 필러로만 구성된 Z250에 비해 낮은 열확산도를 보일 것으로 예상된다. 그로 인해 Z250이 BFP보다 광 조사기의 복사열을 더욱 잘 전달하여 Z250의 ΔTlight가 더 큰 값을 나타냈을 것이며, 이는 이전 연구결과와도 일치하였다(15).
ΔTtotal은 복합레진의 중합열 및 광 조사기의 복사열에 의한 총 온도 변화로 두 가지 발열 인자에 의해 영향을 받는다. 이전 연구에 따르면 전체 광 에너지가 일정한 조건에서 radiant emittance와 조사시간이 변화할 때 microhardness는 일정하였으며, 또한 microhardness와 전환율은 양의 상관관계를 가진다고 알려져 있다(19). 본 연구에서도 광 조사 방법 변화 시 전체 광 에너지를 일정하게 하면서 radiant emittance와 조사시간을 변화시켰으므로 광 조사 방법 변화에 따른 전환율 차이는 없을 것으로 생각할 수 있다. 따라서 ΔTtotal은 초기 광 출력 증가에 따른 중합속도 증가 및 광 조사기에 의한 복사열 증가가 시간의 함수로 서로 영향을 미친 결과로 나타날 것이며, Z250와 BFP 모두 radiant emittance가 가장 큰 100%/20 s 실험군에서 유의하게 높게 나타났다. 50%/40 s 실험군과 Increase/40 s 실험군에서는 Z250에서는 차이가 없었으나 BFP에서는 유의한 차이가 관찰되었다. 따라서 첫 번째, 두 번째 귀무가설은 모두 부분적으로 기각되었다.
복합레진의 종류, 두께 및 색조에 따라 광 투과도 및 열용량, 열확산도가 변화할 수 있으므로 추후 연구에서는 복합레진의 종류, 두께 및 색조를 변화시키며 광 조사 방법 변화에 따른 광중합 시 온도 변화를 측정해볼 필요가 있을 것이다. 또한 치수와 근접한 부위에 적용되는 치수복조 재료 또는 상아질 접착제의 광중합 시 온도 변화에 대해 알아볼 수도 있을 것이다.
결 론
비접촉식 적외선 온도 센서를 이용한 복합레진의 광중합 시 온도 변화에 대한 실시간 분석은 효과적으로 이루어질 수 있었으며, 이를 통해 복합레진의 중합 역학도 평가할 수 있었다. 동일한 광 에너지 조건 하에서 광 조사기의 radiant emittance가 감소하면 복합레진 중합에 의한 최대 온도 상승, 광 조사기 복사열에 의한 최대 온도 상승, 총 최대 온도 상승 모두 감소하였고, 복합레진 중합열에 의한 최대 온도 상승이 나타난 시간은 증가하여 중합 반응이 지연됨을 확인하였다.
References
-
Lai F, Li X, Wang Q, Luo Y, Wang X, Huang X, et al. Reliability of non-contact infrared thermometers for fever screening under COVID-19. Risk Manag Healthc Policy. 2022;15:447-56.
[https://doi.org/10.2147/RMHP.S357567]

-
Aggarwal N, Garg M, Dwarakanathan V, Gautam N, Kumar SS, Jadon RS, et al. Diagnostic accuracy of non-contact infrared thermometers and thermal scanners: a systematic review and meta-analysis. J Travel Med. 2020;27(8):1-17.
[https://doi.org/10.1093/jtm/taaa193]

-
McCabe JF. Cure performance of light-activated composites by differential thermal analysis (DTA). Dent Mater. 1985;1(6):231-4.
[https://doi.org/10.1016/S0109-5641(85)80048-8]

-
Al-Qudah AA, Mitchell CA, Biagioni PA, Hussey DL. Effect of composite shade, increment thickness and curing light on temperature rise during photocuring. J Dent. 2007;35(3):238-45.
[https://doi.org/10.1016/j.jdent.2006.07.012]

- Ozturk B, Ozturk AN, Usumez A, Usumez S, Ozer F. Temperature rise during adhesive and resin composite polymerization with various light curing sources. Oper Dent. 2004;29(3):325-32.
-
Lloyd CH, Joshi A, McGlynn E. Temperature rises produced by light sources and composites during curing. Dent Mater. 1986;2(4):170-4.
[https://doi.org/10.1016/S0109-5641(86)80030-6]

-
Zach L, Cohen G. Pulp response to externally applied heat. Oral Surg Oral Med Oral Pathol. 1965;19:515-30.
[https://doi.org/10.1016/0030-4220(65)90015-0]

-
Baldissara P, Catapano S, Scotti R. Clinical and histological evaluation of thermal injury thresholds in human teeth: a preliminary study. J Oral Rehabil. 1997;24(11):791-801.
[https://doi.org/10.1046/j.1365-2842.1997.00566.x]

-
Maucoski C, Zarpellon DC, Dos Santos FA, Lipinski LC, Campagnoli EB, Rueggeberg FA, et al. Analysis of temperature increase in swine gingiva after exposure to a Polywave®) LED light curing unit. Dent Mater. 2017;33(11):1266-73.
[https://doi.org/10.1016/j.dental.2017.07.021]

-
Stewardson DA, Shortall AC, Harrington E, Lumley PJ. Thermal changes and cure depths associated with a high intensity light activation unit. J Dent. 2004;32(8):643-51.
[https://doi.org/10.1016/j.jdent.2004.06.007]

-
Atai M, Motevasselian F. Temperature rise and degree of photopolymerization conversion of nanocomposites and conventional dental composites. Clin Oral Investig. 2009;13(3):309-16.
[https://doi.org/10.1007/s00784-008-0236-2]

-
Vaidyanathan J, Vaidyanathan TK, Wang Y, Viswanadhan T. Thermoanalytical characterization of visible light cure dental composites. J Oral Rehabil. 1992;19(1):49-64.
[https://doi.org/10.1111/j.1365-2842.1992.tb01590.x]

-
Asmussen E, Peutzfeldt A. Temperature rise induced by some light emitting diode and quartz-tungsten-halogen curing units. Eur J Oral Sci. 2005;113(1):96-8.
[https://doi.org/10.1111/j.1600-0722.2004.00181.x]

-
Al-Qudah AA, Mitchell CA, Biagioni PA, Hussey DL. Thermographic investigation of contemporary resin-containing dental materials. J Dent. 2005;33(7):593-602.
[https://doi.org/10.1016/j.jdent.2005.01.010]

-
Kim MJ, Kim RJ, Ferracane J, Lee IB. Thermographic analysis of the effect of composite type, layering method, and curing light on the temperature rise of photo-cured composites in tooth cavities. Dent Mater. 2017;33(10):e373-e83.
[https://doi.org/10.1016/j.dental.2017.07.007]

-
Jo SA, Lee CH, Kim MJ, Ferracane J, Lee IB. Effect of pulse-width-modulated LED light on the temperature change of composite in tooth cavities. Dent Mater. 2019;35(4):554-63.
[https://doi.org/10.1016/j.dental.2019.01.009]

-
Komori A, Ishikawa H. The effect of delayed light exposure on bond strength: light-cured resin-reinforced glass ionomer cement vs light-cured resin. Am J Orthod Dentofac Orthop. 1999;116(2):139-45.
[https://doi.org/10.1016/S0889-5406(99)70210-6]

-
Uhl A, Mills RW, Jandt KD. Polymerization and light-induced heat of dental composites cured with LED and halogen technology. Biomaterials. 2003;24 (10):1809-20.
[https://doi.org/10.1016/S0142-9612(02)00585-9]

-
Lee CH, Ferracane J, Lee IB. Effect of pulse width modulation-controlled LED light on the polymerization of dental composites. Dent Mater. 2018;34(12):1836-45.
[https://doi.org/10.1016/j.dental.2018.10.003]

-
Wang Z, Landis FA, Giuseppetti AA, Lin-Gibson S, Chiang MY. Simultaneous measurement of polymerization stress and curing kinetics for photo-polymerized composites with high filler contents. Dent Mater. 2014;30(12):1316-24.
[https://doi.org/10.1016/j.dental.2014.09.006]

-
Vaidyanathan J, Vaidyanathan TK. Computer- controlled differential scanning calorimetry of dental composites. IEEE Trans Biomed Eng. 1991;38(4): 319-25.
[https://doi.org/10.1109/10.133224]

-
Halvorson RH, Erickson RL, Davidson CL. The effect of filler and silane content on conversion of resin-based composite. Dent Mater. 2003;19(4):327-33.
[https://doi.org/10.1016/S0109-5641(02)00062-3]

-
Atai M, Watts DC. A new kinetic model for the photopolymerization shrinkage-strain of dental composites and resin-monomers. Dent Mater. 2006;22 (8):785-91.
[https://doi.org/10.1016/j.dental.2006.02.009]

-
Sang EJ, Kim JY, Lim BS, Choi NS, Lee IB. Effect of initiator and inhibitor concentration on the polymerization shrinkage kinetics of experimental dental composites. Korean J Dent Mater. 2014;41:29-38.
[https://doi.org/10.14815/kjdm.2014.41.1.29]

-
Atai M, Watts DC, Atai Z. Shrinkage strain-rates of dental resin-monomer and composite systems. Biomaterials. 2005;26(24):5015-20.
[https://doi.org/10.1016/j.biomaterials.2005.01.022]

-
Xu T, Li X, Wang H, Zheng G, Yu G, Wang H, et al. Polymerization shrinkage kinetics and degree of conversion of resin composites. J Oral Sci. 2020;62 (3):275-80.
[https://doi.org/10.2334/josnusd.19-0157]

-
Braden M. Heat conduction in teeth and the effect of lining materials. J Dent Res. 1964;43:315-22.
[https://doi.org/10.1177/00220345640430030201]

-
Watts DC, McAndrew R, Lloyd CH. Thermal diffusivity of composite restorative materials. J Dent Res. 1987;66 (10):1576-8.
[https://doi.org/10.1177/00220345870660101201]

-
Lachowski KM, Botta SB, Lascala CA, Matos AB, Sobral MA. Study of the radio-opacity of base and liner dental materials using a digital radiography system. Dentomaxillofac Radiol. 2013;42(2):20120153.
[https://doi.org/10.1259/dmfr.20120153]


