Plasma electrolytic oxidized surface of (Mg/Si)-hydroxyapatite coated Ti-29Nb-xHf alloys for dental implant
Abstract
In this study, in order to form a micropore oxide film containing (Mg/Si)-hydroxyapatite on the surface of a Ti-29Nb-xHf alloy, pores were formed on the surface of the alloy by plasma electrolytic oxidation (PEO) and the morphology of the surface was studied. For this, Ti-29Nb, Ti-29Nb-3Hf, Ti-29Nb-7Hf, and Ti-29Nb-15Hf alloys were prepared by arc melting. Micropores were formed on the surface in an electrolyte solution containing Mg and Si ions using PEO. Surface characteristics and mechanical properties of all specimens were investigated using OM, FE-SEM, XRD, EDS, Vickers hardness and nanoindenter. Bone formation was performed in SBF solution, and the following results were obtained. Ti-29Nb, Ti-29Nb-3Hf, and Ti-29Nb-7Hf showed mainly needle-like martensitic structures, and Ti-29Nb-15Hf alloys showed mainly equiaxed structures. From the result of the mechanical property analysis, the elastic modulus and hardness of the Ti-29Nb alloy decreased, as the Hf content increased. Under the condition of same applied voltage, as the content of Mg ions increased, the diameter of the micropores became smaller and uniform pores were formed. The Ca/P and (Ca+Mg)/(Si+P) ratios decreased, as the Mg content increased, and at 5% Mg, the ratio was similar to that of natural bone. Bone growth was nucleated around the pore.
초록
본 연구에서는 Ti-29Nb-xHf 합금표면에 (Mg/Si)-hydroxyapatite 코팅된 마이크로 포어 산화막을 형성하기 위하여 플라즈마 전해 산화법(PEO)으로 합금표면에 포아를 형성하여 표면의 형태를 연구하였다. 이를 위하여 아-크용해법을 이용하여 Ti-29Nb, Ti-29Nb-3Hf, Ti-29Nb-7Hf, 및 Ti-29Nb-15Hf 합금을 제조하고, 플라즈마 전해 산화법을 이용하여 Mg, Si 이온이 함유된 전해액에서 표면에 마이크로 포아를 형성하였다. 모든 시편의 표면특성과 기계적특성은 OM, FE-SEM, XRD, EDS, 비커스경도계 및 나노인덴터를 이용하여 조사하였으며, 뼈의 형성을 SBF용액에서 수행하여 다음과 같은 결과를 얻었다. Ti-29Nb, Ti-29Nb-3Hf, 및 Ti-29Nb-7Hf에서 주로 층상과 침상의 마르텐사이트구조를 보였으며 Ti-29Nb-15Hf 합금에서는 주로 등축구조가 관찰되었다. 기계적 특성의 분석 결과, Ti-29Nb 합금에 Hf 함량이 증가함에 따라 탄성계수와 경도가 감소하였다. 인가전압이 동일한 환경에서 Mg 이온의 함량이 높아질수록 마이크로 기공의 직경이 작아지고 균일한 기공이 형성되었다. Ca/P 및 (Ca+Mg)/(Si+P)비율이 Mg의 함량이 증가할수록 감소하였으며 5%의 Mg에서 자연뼈와 비슷한 비율을 나타냈다. 뼈의 성장은 그 기공주변에서 핵생성이 되었다.
Keywords:
Ti-29Nb-xHf alloy, Plasma electrolytic oxidation, Martensite, Elastic modulus키워드:
Ti-29Nb-xHf 합금, 플라즈마 전해 산화, 마르텐사이트, 탄성계수Introduction
Commercial pure titanium (CP-Ti) and titanium (Ti) alloys have been used as an implant material from orthopedics and dental field. Because, its alloys have low elastic modulus, mechanical properties, good corrosion resistance, and excellent biocompatibility (1, 2). However, CP-Ti and Ti alloys have some problems such as high modulus of elasticity and toxicity. Especially, Ti-6Al-4V alloy has toxic elements such as Alzheimer’s disease of Al element and toxicity of V element, it can create harmful environment (3-5). So, some researchers have studied on problems of Ti alloys. They have focused on nontoxic element such as niobium (Nb), hafnium (Hf), tantalum (Ta), and zirconium (Zr) for controlling the contents. Especially, Nb and Hf element are effective titanium β-stabilizers and complete mutual solubility in Ti phases (6-9). Therefore, Nb and Hf element will have superior properties of alloys and biocompatibility such as the Ti-Nb-Hf alloy.
Many researchers have studies various surface modifications of Ti alloys to improve their bioactivity due to insufficient adhesion of cells on bulk Ti surface. The plasma electrolytic oxidation (PEO) is one of various process, it can occur very quickly to anodic spark oxidation from TiO2 again. Micro-arc oxidation and anodic spark oxidation are created based on PEO process. The micro-arc oxidation shows many advantages, such as adhesion of substrate metal, corrosion of Ti alloy and biocompatibility of Ti alloy surfaces to improve a surface property (10, 11). From previous reports, anodized TiO2 surface provided higher cell adhesion, proliferation, and cells cultured on anodized TiO2 surfaces, it leads to higher ALP activity, compared with the control surface such as a physical change (12, 13). In particular, the PEO process can control the electrolyte composition, applied voltage, current density, and application time, which are the conditions for doping Ca and P ions on the TiO2 surface (10, 14-16). The PEO process for bioactive surfaces can be performed in electrolytes containing Ca and P ions and other ions. Natural bone is composed of mineral elements such as magnesium (Mg), silicon (Si), zinc (Zn), strontium (Sr), and manganese (Mn), etc. Especially, Mg is closely related to indirectly affect mineral metabolism and calcification of bone tissue. Also, role of Si deficiency has been reported to affect bone formation and growth after clinical implantation of bio-implants (17-19). Although these elements improve biocompatibility, there were a little researches focused on morphology changes of PEO-treated Ti alloy in electrolyte containing Ca, P, Mg, and Si ions for improvement of biocompatibility.
Therefore, the purpose of this study is to observe the surface behavior and morphology change after coating with HA containing Mg and Si using the PEO method on the Ti-29Nb-xHf alloy surface.
Materials and Methods
The CP Ti (Grade 4, G&S Titanium, Wooster, OH, USA), Nb, and Hf (99.95 wt.% purity, Kurt J. Lesker Company, Jefferson Hills, PA, USA) were used for making the Ti-29Nb-xHf (×= 0, 3, 7 and 15) alloys. And prepared alloys were cleaned by ultrasonic cleaner with acetone and ethanol. After cleaning, all alloys were dried thoroughly.
The Ti-29Nb-xHf alloys were prepared by using the vacuum arc melting furnace (Vacuum arc melting system, SVT, Gyeonggi-do, Korea) at high-purity Ar gas. The gas was filled up to water cooling copper hearth in vacuum atmosphere. For keeping vacuum, atmosphere was controlled by fine gage. To avoid inhomogeneity of Ti-29Nb-xHf alloys, ingots were remelted at least 10 times in Ar atmosphere and then homogenization treatment was carried out using tube furnace at 1050 ℃ (MSTF-1650, MS Eng, Busan, Korea) for 12 hrs, and then 0 ℃ water quenching. The ingots were cut off by using diamond wheel cutting system (Accutom-5, Struers, Ballerup, Denmark) with a thickness of 3.0 mm and diameter of 10 mm for PEO experiments, and then ultrasonically cleaned in acetone and finally dried in air.
Microstructures of the Ti-29Nb-xHf alloys were analyzed by optical microscopy (OM; BM60 M, Olympus, Tokyo, Japan) after etching in Keller’s reagent (2 mL HF + 3 mL HCl + 5 mL NHO3 + 190 mL H2O). The compositions of each alloys were identified by X-Ray fluorescence (XRF; Analyzer serial number-581331, Olympus, Tokyo, Japan). The phase and composition of each alloy were observed by using X-ray diffractometer (XRD; X’pert PRO, Philips, Amsterdam, Netherland). A JCPDS file was used to identify each peak in this study.
The washed Ti-29Nb and Ti-29Nb-15Hf alloys were used as anode and a carbon rod was used as the cathode in different electrolytes containing Mg concentration of 0% (CaP), 5% (5Mg), 10% (10Mg), and 20% (20Mg), as shown in Table 1. The micro-pore formation was carried out using by DC power supply (KDP-1500, Unicorn, Korea) at 270 V for 3 min as shown in Table 2. The current density was applied to 70 mA in anodizing process. The morphologies of micro-pore formed Ti-29Nb and Ti-29Nb-15Hf were observed by a FE-SEM, EDS, and XRD. The Image J analyzer (http://rsb.info.nih.gov/ij/, NIH, Bathesda, MA, USA) and Image analyzer software (Image Pro Plus, Media Cybernetics, Rockville, MA, USA) were used for measuring the surface fraction of porosity and pore size from FE-SEM image of micro-pore formed alloy.
The elastic modulus (E) and the hardness (H) of the Ti-29Nb-xHf alloy were measured by using nano-indentation tester (TTX-NHT3, Anton Paar, Graz, Austria) and Vickers hardness tester (DM-2D, AFFRI, Induno Olona VA, Italy). The nano-indentation test was performed at allowable load range of 500 mN, a pulling speed of 25 mN/min, depth range (min.=40 µm, and max.=200 µm). At least five measurements were obtained for each alloy in the nano-indentation test.
The PEO-treated Ti-29Nb and Ti-29Nb-15Hf specimens in solution containing Ca, P, Mg, and Si ions were prepared to examine the bioactivity in simulated body fluid (SBF) for 1 day. The ion concentrations of the SBF were listed in Table 3. Each specimen was placed in a beaker with SBF solution. The pH condition of SBF solution was kept in an incubator at 36.5 ℃.
Results and Discussions
Figure 1 shows optical microscopy (OM) images of Ti-29Nb-xHf alloys with different Hf contents (0, 3, 7, and 15 wt. %) after chemical etching in Keller’s solution. Figure 1(a) is Ti-29Nb, (b) is Ti-29Nb-3Hf, (c) is Ti-29Nb-7Hf, and (d) is Ti-29Nb-15Hf alloy, respectively. The micro- structure of the Ti-29Nb alloy showed needle-like structure in grain. And needle-like structure changed to an equiaxed grain structure with increasing Hf content. The needle-like structures were gradually disappeared as shown in Figure 1(d) as Hf content increased. The elements that mainly form the beta structure are known to be Ta and Nb. The reason for the change to the beta structure as Hf increases in is thought to be that Hf and Nb have similar chemical properties in Ti-29Nb-xHf alloys (6, 10).
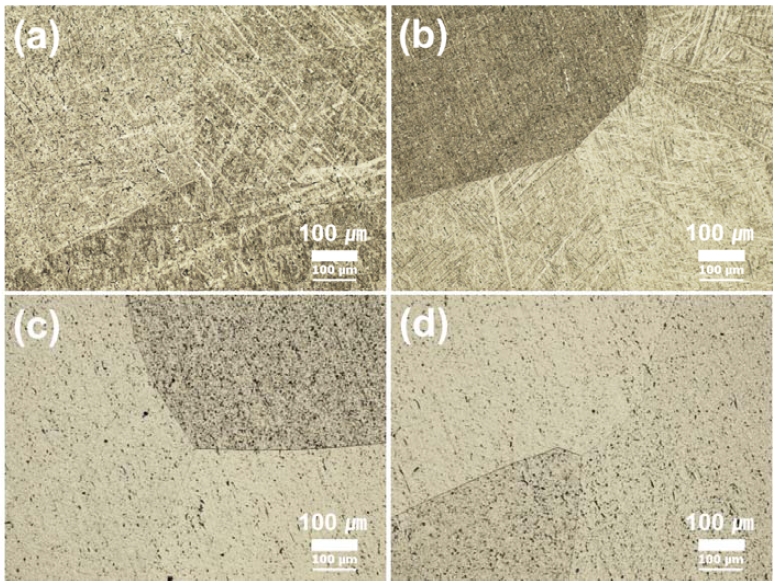
OM images of Ti-29Nb-xHf alloys after heat treatment at 1050 ℃ for 12 hrs in Ar atmosphere, followed by 0 ℃ water quenching: (a) Ti-29Nb, (b) Ti-25Nb-3Hf, (c) Ti-29Nb-7Hf, and (d) Ti-29Nb-15Hf.
Figure 2 shows the XRD peaks of Ti-29Nb-xHf alloy. Figure 2(a) is Ti-29Nb, (b) is Ti-29Nb-3Hf, (c) is Ti-29Nb-7Hf, and (d) is Ti-29Nb-15Hf alloy, respectively. The peaks of α″phase showed higher intensity such as (100), (020), (101), and (021) in Ti-29Nb alloy compared to alloys containing Hf element in Figure 2(a). Especially, From Figure 2(b-c), Ti-29Nb-3Hf and Ti-29Nb-7Hf alloys showed the α″+ β phases. However, in the case of Ti–29Nb-15Hf alloys in Figure 2(d), the β phase peaks such as (110), (200), and (211) have higher intensity compared to other alloys, change with increasing Hf content. From the previous study, Hf content of above 15 wt.% in Ti-Nb binary alloys was changed needle-like to equiaxed microstructure and α″to β-phase (19). It is confirmed that needle-like microstructure is mainly composed of α″-phase and equiaxed microstructure mainly consists of β-phase as shown in Figure 1.
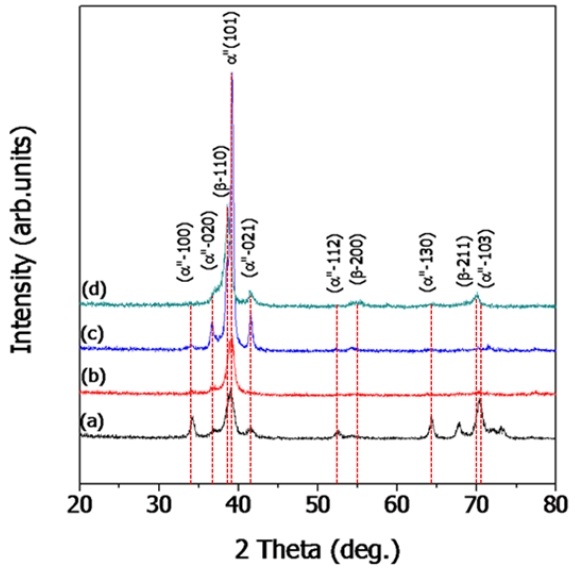
XRD analysis results of Ti-29Nb-xHf alloys after heat treatment at 1050 ℃ for 12 hrs in Ar atmosphere, followed by 0 ℃ water quenching: (a) Ti-29Nb, (b) Ti-29Nb-3Hf, (c) Ti-29Nb-7Hf, and (d) Ti-29Nb-15Hf.
Figure 3 shows the Vickers hardness results of Ti-29Nb-xHf alloys. Figure 3 is (a) Ti-29Nb, (b) is Ti-29Nb-3Hf, (c) is Ti-29Nb-7Hf, and (d) is Ti-29Nb-15Hf. The Vickers hardness results of water quenched Ti-29Nb-xHf alloys are shown in Table 4. The Vickers hardness for Ti-29Nb alloy was 200.4±5.66 Hv, while the hardness for the Ti-29Nb-3Hf, Ti-29Nb-7Hf, and Ti-29Nb-15Hf alloys were 189±7.96 Hv, 186±3.19 Hv, and 185±4.24 Hv, respectively. From these values, the hardness value tends to decrease as Hf is added to the Ti-Nb alloy because the phase transformation to the β-phase occurs as discussed in the previous observation of the alloy structure. That is, the hardness decreased slightly and phase transformation occurred from α″-phase (hexagonal structure) to the β-phase(body centered cubic), as the Hf element increased. This phase transformation reduces the elastic modulus of the material and its hardness (19, 20).
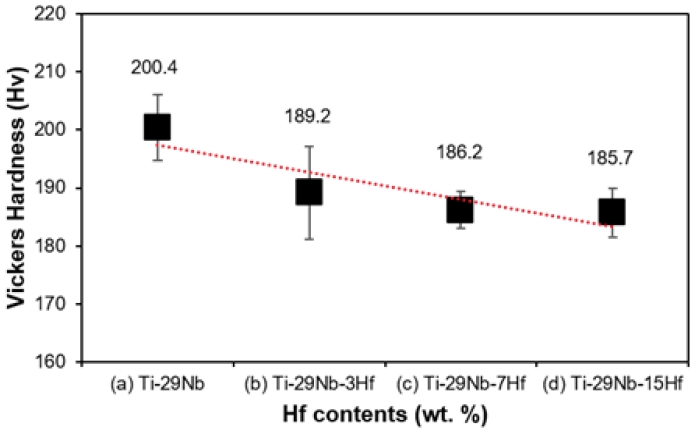
Vicker’s hardness graph of Ti-29Nb-xHf alloy: (a) Ti-29Nb, (b) Ti-29Nb-3Hf, (C) Ti-29Nb-7Hf, and (d) Ti-29Nb-15Hf.
Figure 4 shows the nano-indentation test results of Ti-29Nb-xHf alloys. The elastic modulus was measured using by nano-indentation. The nano-indentation test results of water quenched Ti-29Nb-xHf alloys are shown in Table 4. The results of elastic modulus for Ti-29Nb alloy was 99.29±2.00 GPa, while hardness for the Ti-29Nb-3Hf, Ti-29Nb-7Hf, and Ti-29Nb-15Hf alloys were 94.71±2.36, 94.36±2.31, and 88.04±1.92, respectively. The elastic modulus of Ti-29Nb-15Hf alloy was the lower than those of samples with high content of Hf. It has been reported that a decrease in the value of the modulus of elasticity is associated with an increase in the β phase (10, 20). If the modulus of elasticity is controlled to solve the stress shielding effect, it is thought that bone resorption and bone fracture around the implant can be prevented. Therefore, in this study, the value of the modulus of elasticity can be reduced by adding the Hf element to the Ti-29Nb alloy.
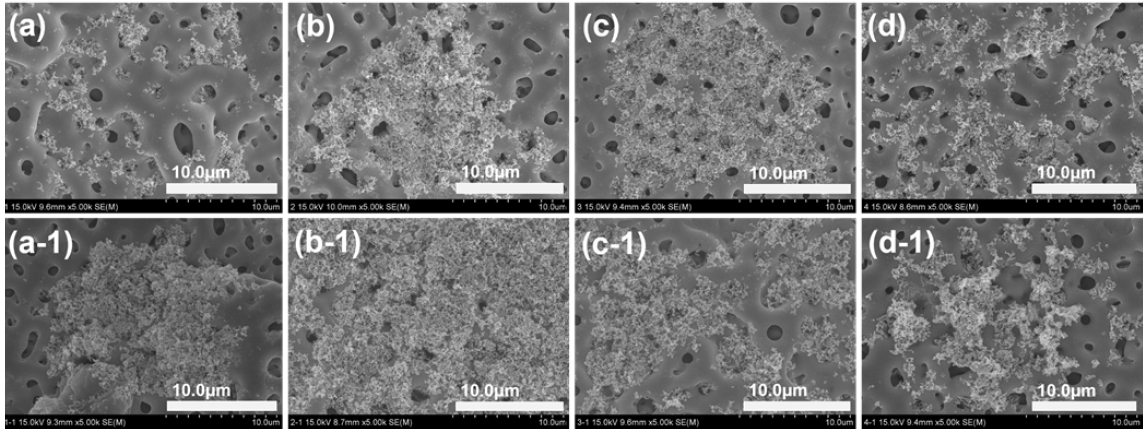
Figure 5 shows the FE-SEM morphologies of PEO treated Ti-29Nb alloy (a, b, c, and d) and Ti-29Nb-15Hf alloy (a-1, b-1, c-1, and d-1) with different electrolytes containing various concentrations of (a and a-1) 0 Mg (b and b-1) 5 Mg, (c and c-1) 10 Mg, and (d and d-1) 20 Mg ions, respectively. PEO treatment was performed at 270 V for 3 min on Ti-29Nb and Ti-29Nb-15Hf alloys in the electrolyte containing Ca, P, Mg, and Si ions. From the FE-SEM observation, the various types of micro-porous oxide layers were formed as shown in Figure 5. The number of micro-pore increased with increasing Mg concentration, whereas, the size of micro-pore decreased with increasing Mg concentration. Also, the number and the size of micro-pore formed Ti-29Nb-15Hf alloy were occurred with the tendency like Ti-29Nb alloy with increasing Mg concentration. And chemical composition of oxide layer was investigated by EDS analysis. It was confirmed that the oxide films on Ti-29Nb and Ti-29Nb-15Hf alloy were in good on the composed of the alloying elements, including O, Ca, P, Mg, and Si elements. In the PEO process, Mg and Si ions in electrolyte are drawn into discharge channel due to electric fields, and competition of Mg and Si ions in the solution are occurred for substitution with Ca and P. In the case of Mg2+ ions, the dehydration of aqueous ions, which needs to occur before incorporation into the crystalline structure, is slow. Also, it thought that the smaller ionic radius of Mg2+ (0.0069 nm) might also affect the substitution for Ca2+ (0.099 nm) in apatite (14, 21, 22). Therefore, it is thought that these ions were doped into the surface of the alloy during the PEO treatment, and these elements were detected together with the alloying elements on the surface.
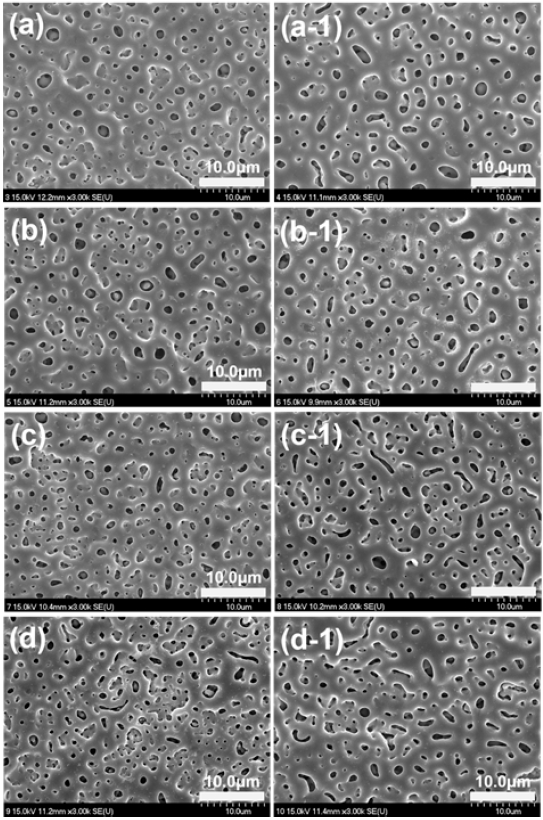
FE-SEM morphologies of PEO-treated Ti-29Nb alloy(a, b, c, and d) and Ti-29Nb-15Hf alloy(a-1, b-1, c-1, and d-1) with different electrolytes containing Mg concentration of (a and a-1) 0 Mg (b and b-1) 5 Mg, (c and c-1) 10 Mg, and (d and d-1) 20 Mg.
Figure 6 shows the FE-SEM and images of micro-pore distribution formed Ti-29Nb and Ti-29Nb-15Hf alloy by PEO treatment with different electrolytes containing various concentrations of (a and a-1) 0 Mg (b and b-1) 5 Mg, (c and c-1) 10 Mg, and (d and d-1) 20 Mg ions. The summarized values for the micro-pore formed on Ti-29Nb and Ti-29Nb-15Hf alloy were obtained using by Image J software and Image analyzer software. Figure 6(a) is 0 Mg, (b) is 5 Mg, (c) is 10 Mg, and (d) is 20 Mg for Ti-29Nb alloy. And Figure 6(a-1) is 0 Mg, (b) is 5 Mg, (c) is 10 Mg, and (d) is 20 Mg for Ti-29Nb-15Hf alloy, respectively. The change in the number of pores and pore size according to the Mg concentration of the electrolyte is shown in the figures. The average numbers of micro-pore formed on Ti-29Nb alloy with the Mg ion concentration were 22.98±1.77 for 0 Mg, 31.35±1.75 for 5 Mg, 54.33±1.34 for 10 Mg, and 59.45±0.15 for 20 Mg, respectively. The average numbers of micro-pore formed on Ti-29Nb-15Hf alloy with the Mg ion concentration were 23.43±2.11 for 0 Mg, 31.66±2.32 for 5 Mg, 55.67±1.54 for 10 Mg, and 60.77±0.23 for 20 Mg, respectively. It is confirmed that the numbers of micro-pore depends on the composition of electrolyte with added ions and the chemical composition of the alloy. In the case of the Ti-29Nb alloy, as the Mg concentration increased from 0 Mg to 20 Mg for a constant alloy composition, the mean pore size decreased drastically from 1.35±0.09 to 0.83±0.29. It is thought that the activation energy depend on the increasing Mg concentration in the solution to attack on the alloy surface leading to the a small size of micro-pore formation gradually. In the case of the Ti-29Nb-15Hf alloy, as the Mg concentration increased from 0 Mg to 20 Mg for a constant alloy composition, the mean pore size decreased drastically from 1.51±0.08 to 0.89±0.34. The area of occupied by micro-pore for Ti-29Nb alloy with increasing Mg concentration was 10.59±0.33, 11.02±0.47, 12.17± 0.55, and 13.15±0.32 and the area of occupied by micro-pore for Ti-29Nb-15Hf alloy with increasing Mg concentration was 9.83±0.29, 10.99±0.44, 12.38±0.51, and 13.11±0.41, respectively. The summarized values of the micro-pore number and pore sizes for the Ti-29Nb and Ti-29Nb-15Hf alloy with Mg concentration are shown in Table 5. From these changes, it can be seen that the size of pores and the number of pores change according to the Mg concentration is because the concentration of ions affected the spark discharge during the PEO treatment process, and the component and composition of the alloy have an effect.
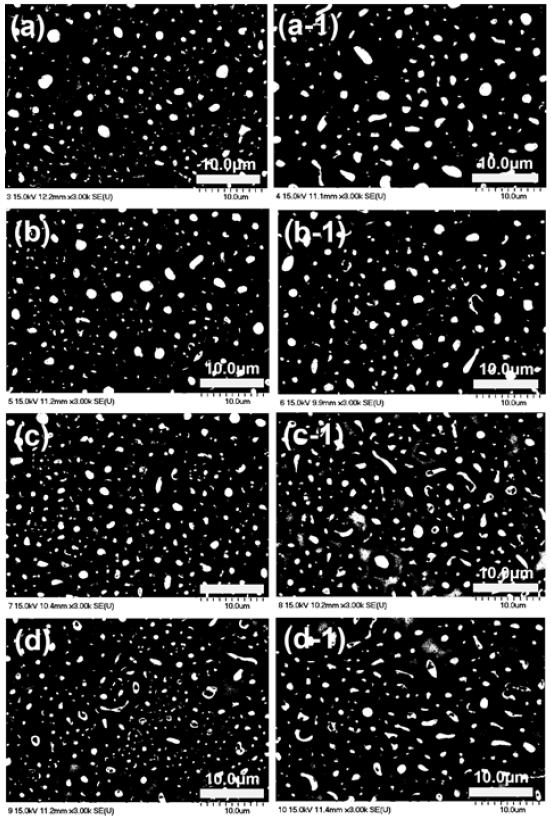
Pore distribution images of micro-pore formed Ti-29Nb and Ti-29Nb-15Hf alloy by PEO processing with different electrolytes containing Mg concentration of (a and a-1) 0 Mg, (b and b-1) 5 Mg, (c and c-1) 10 Mg, and (d and d-1) 20 Mg.

The summarized data from image analysis for the micro-pore formed on Ti-29Nb and Ti-29Nb-15Hf alloy after PEO treatment.
Figure 7 shows the EDS mapping analysis results of PEO-treated (a) Ti-29Nb and (b) Ti-29Nb-15Hf alloys in electrolytes containing Ca, P, Mg, and Si ions, respectively. As a result of the EDS mapping analysis, Ca/P ratio was obtained on PEO-treated alloy surface and Ca, P, Mg, and Si elements were well distributed on the sample surface. In Figure 7, Ca/P ratios were calculated on the oxide film surface, and summarized in Table 6. The Ca/P ratios of Ti-29Nb and Ti-29Nb-15Hf alloy were 1.62 and 1.64, respectively. Also, as the Mg content increase, the Ca/P ratio tends to decrease. This is because Mg replaces Ca in the HA structure to decrease the Ca/P ratio. Although it is judged that there is little change in the value by substituting Si with P, the Ca/P ratio was eventually decreased because the Mg content was increased to 20%.

Variation of Ca/P molar ratio with different electrolytes of Mg ion concentration: (a) Ca/P ratio and (b) (Ca+Mg/P+Si) ratio.

EDS mapping results of PEO-treated Ti-29Nb and Ti-29Nb-15Hf alloy in various electrolytes with Mg ion concentration.
Therefore, Mg and Si ions, which are bioactive ions on the PEO-treated implant surface, are thought to have a favorable effect on biocompatibility and cell and bone bonding (23, 24).
Figure 8 shows the TF-XRD patterns of PEO treated Ti-29Nb (A) and Ti-29Nb-15Hf (B) alloy with electrolytes containing various concentration of (a) 0 Mg, (b) 5 Mg, (c) 10 Mg, and (d) 20 Mg ions, respectively. The peaks of TiO2 consisted predominantly of anatase with small amount of rutile, which was mixture structure as shown in the surface of the micro-pore formed Ti-29Nb and Ti-29Nb-15Hf alloys. Regarding with this result, the hydroxyapatite and anatase phases are believed to have more efficient nucleation and growth than the rutile layer because of their good lattice match (25, 26).
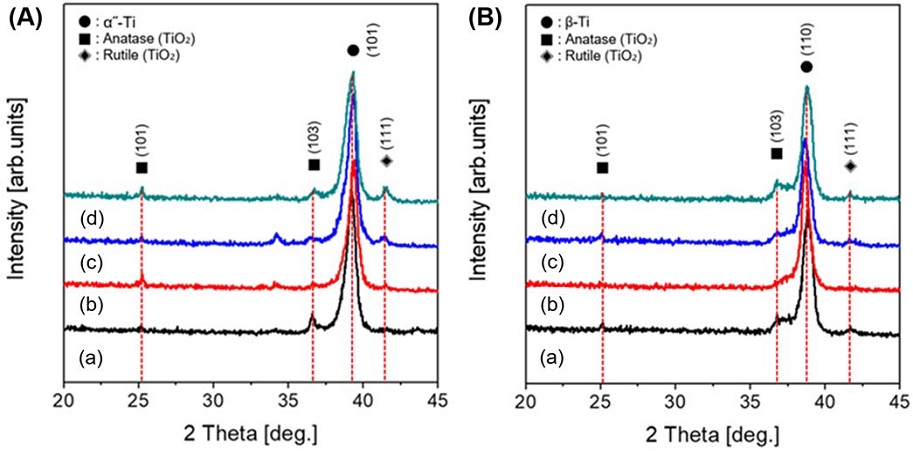
TF-XRD patterns of PEO-treated Ti-29Nb (A) and Ti-29Nb-15Hf (B) alloy with different electrolytes of Mg ion concentration: (a) 0 Mg, (b) 5 Mg, (c) 10 Mg, and (d) 20 Mg.
Figure 9 shows the FE-SEM images morphology of bone-like apatite formed Ti-29Nb and Ti-29Nb-15Hf alloys with Mg ion concentration after PEO treatment at 270 V for 3 min. Figure 9(a) is 0 Mg, (b) is 5 Mg, (c) is 10 Mg, and (d) is 20 Mg for micro-pore formed Ti-29Nb surface, and Figure 9(a-1) is 0 Mg, (b-1) is 5 Mg, (c-1) is 10 Mg, and (d-1) is 20 Mg, respectively. From the bone-like apatite formed results, bone-like apatite is well formed on the surface of PEO-treated Ti-29Nb-15Hf alloy in electrolyte containing 5 Mg and 5 Si ion concentration compared to the other specimen after SBF immersion. In general, these reactions are thought to be affected by the action of Mg and Si ions in the human body. Mg and Si ions are closely related to the calcification of human tissues and are known to indirectly affect mineral metabolism (27).
Conclusion
The microstructure of the Ti-29Nb-xHf alloys showed α″-and β-phase. As the Hf content increased, the needle-like structure decreased and the equiaxed structure with β-phase increased. The hardness of Ti-29Nb-xHf alloy decreased slightly, and elastic modulus decreased, as the Hf content increased. The PEO-treated alloy showed the uniform micro-pore formation on the surface. In the case of PEO-treated Ti-29Nb-xHf alloys in electrolytes containing Mg ion, pore size decreased and numbers increased compared to PEO-treated Ti-29Nb-xHf alloys in electrolytes without Mg ion. From the XRD analysis, in the case of Mg ion addition to electrolyte, the anatase peak on the Ti-29Nb-xHf alloy was shifted slightly to left side with a lower diffraction angle. The Ca/P and (Ca+Mg)/(Si+P) ratios were the closest to the ideal value for PEO-treated Ti-29Nb and Ti-29Nb-15Hf in solution containing 5 Mg ion. Also, these ratios of PEO-treated Ti-29Nb-xHf alloys in solution containing Mg and Si ions decreased as Mg ion increased. The PEO-treated Ti-29Nb-15Hf alloy in electrolytes containing 5 Mg ion was a good bone formation around the pores and surfaces.
References
-
Wang CX, Wang M, Zhou X. Nucleation and growth of apatite on chemically treated titanium alloy: an electrochemical impedance spectroscopy study. Biomaterials. 2003;24(18):3069-77.
[https://doi.org/10.1016/S0142-9612(03)00154-6]

-
Okazaki Y, Ito Y, Ito A, Tateishi T. Effect of alloying elements on mechanical properties of titanium alloys for medical implants. J Inst Metals. 1993;34(12):1217-22.
[https://doi.org/10.2320/matertrans1989.34.1217]

-
Niinomi M. Fatigue performance and cyto-toxicity of low rigidity titanium alloy, Ti–29Nb–13Ta–4.6Zr. Biomaterials. 2003;24(16):2673-83.
[https://doi.org/10.1016/S0142-9612(03)00069-3]

-
Saji VS, Choe HC, and Brantely WA. An electrochemical study on self-ordered nanoporous and nanotubular oxide on Ti–35Nb–5Ta–7Zr alloy for biomedical applications. Acta Biomater. 2009;5(6):2303-10.
[https://doi.org/10.1016/j.actbio.2009.02.017]

-
Park SY, Choe HC. Effects of Hf content on nanotubular structure of Ti-29Nb-xHf ternary alloys. Surf Coat Technol. 2017;320:109-17.
[https://doi.org/10.1016/j.surfcoat.2017.01.094]

-
Zhou YL, Niinomi M, Akahori T. Changes in mechanical properties of Ti alloys in relation to alloying additions of Ta and Hf. Mater Sci Eng A. 2008;483-484:153-6.
[https://doi.org/10.1016/j.msea.2006.09.173]

-
Cai Z, Koike M, Sato H, Brezner M, Guo Q, Komatsu M, Okuno O, Okabe T. Electrochemical characterization of cast Ti–Hf binary alloys. Acta Biomater. 2005;1(3):353-6.
[https://doi.org/10.1016/j.actbio.2005.02.006]

- Boyer R, Welsch G, Collings EW. Materials properties handbook: titantium alloys, ASM, Metals Park, Ohio. 1993:483.
-
Andrade MC, Sader MS, Filgueiras MRT, Orasawara T. Microstructure of ceramic coating on titanium surface as a result of hydrothermal treatment. J Mater Sci Mater Med. 2000;11(11):751-5.
[https://doi.org/10.1023/A:1008984030540]

-
Hwang IJ, Choe HC, Brantley WA. Electrochemical chracteristics of Ti-6Al-4V after plasma electrolytic oxidation in solution containing Ca, P, and Zn ions. Surf Coat Technol. 2017;320:458-66.
[https://doi.org/10.1016/j.surfcoat.2016.11.092]

-
Kalita SJ, Bhatt HA. Nanocrystalline hydroxyapatite doped with magnesium and zinc: Synthesis and characterization. Mater Sci Eng C. 2007;27(4):837-48.
[https://doi.org/10.1016/j.msec.2006.09.036]

-
Ratner BD, Hoffman AS, Schoen FJ, Lemons JE. Biomaterials science: an introduction to materials in medicine. Academic Press, New York. 1996.
[https://doi.org/10.1016/B978-012582460-6/50002-5]

-
Park JB. Biomaterials science and engineering. Plenum Press, New York. 1984.
[https://doi.org/10.1007/978-1-4613-2769-1]

-
Boanini E, Gazzano M, Bigi A. Ionic substitutions in calcium phosphates synthesized at low temparature. Acta Biomater. 2010;6(6):1882-94.
[https://doi.org/10.1016/j.actbio.2009.12.041]

-
Hanaor DA, Sorrell CC. Review of the anatase to rutile phase trabsformation. J Mater Sci. 2011;46:855-74.
[https://doi.org/10.1007/s10853-010-5113-0]

-
Choe HC, Kim WG, Jeong YH. Surface characteristics of HA coated Ti-30Ta-xZr and Ti-30Nb-xZr alloys after nanotube formation. Surf Coat Technol. 2010;205:S305-11.
[https://doi.org/10.1016/j.surfcoat.2010.08.020]

-
Yu JM, Choe HC. Mg-containing hydroxyapatite coatings on Ti-6Al-4V alloy for dental materials. Appl Surf Sci. 2018;432:294-99.
[https://doi.org/10.1016/j.apsusc.2017.06.263]

-
Park SY, Jo CI, Choe HC. Hydroxyapatite deposition on micropore-formed Ti-Ta-Nb alloys by plasma electrolytic oxidation for dental applications. Surf Coat Technol. 2016;294:15-20.
[https://doi.org/10.1016/j.surfcoat.2016.03.056]

-
Park SY, Choe HC. Mn-coatings on the micro-pore formed Ti-29Nb-xHf alloys by RF-magnetron sputtering for dental applications. Appl Surf Sci. 2018;432:278-84.
[https://doi.org/10.1016/j.apsusc.2017.08.023]

-
Park SY, Choe HC. Variations of nanotubes on the Ti-Nb-Hf alloys with applied voltages. Thin Solid Films. 2016;620:119-25.
[https://doi.org/10.1016/j.tsf.2016.09.061]

-
MoreiraM P, de Almeida Soares GD, Dentzer J, Anselme K, de SenaL A, Kuznetsov A, dos Santos EA. Synthesis of magnesium and manganese-doped hydroxyapatite structures assisted by the simultaneous incorporation of strontium. Mater Sci Eng C. 2016;61:736-43.
[https://doi.org/10.1016/j.msec.2016.01.004]

-
Xue W, Dahlquist K, Banerjee A, Bandyopadhyay A, Bose S. Synthesis and characterization of tricalcium phosphate with Zn and Mg based dopants. J Mater Sci Mater Med. 2008;19(7):2669-77.
[https://doi.org/10.1007/s10856-008-3395-4]

-
Schwartz Z, Martin JY, Dean DD, Simpson J, Cochran DL, Boyan BD. Effect of titanium surface roughness on chondrocyte proliferation, matrix production, and differentiation depends on the state of cell maturation. J Biomed Mater Res. 1996;30(2):145-55.
[https://doi.org/10.1002/(SICI)1097-4636(199602)30:2<145::AID-JBM3>3.0.CO;2-R]

-
Li X, Sogo Y, Ito A, Mutsuzaki H, Ochiai N, Kobayashi T. The optimum zinc content in set calcium phosphate cement for promoting bone formation in vivo. Mater Sci Eng. 2009;29(3):969-975.
[https://doi.org/10.1016/j.msec.2008.08.021]

-
Kaseem M, Choe HC. Triggering the hydroxyapatite deposition on the surface of PEO-coated Tie6Ale4V alloy via the dual incorporation of Zn and Mg ions. J Alloys Compd. 2020;819:153038.
[https://doi.org/10.1016/j.jallcom.2019.153038]

-
Park SY, Choe HC. Functional element coatings on Ti-alloys for biomaterials by plasma electrolytic oxidation. Thin Solid Films. 2020;699:137896
[https://doi.org/10.1016/j.tsf.2020.137896]

- Brägger U, Bürgin W, Lang NP, Buser D. Digital subtraction radiography for the assessment of changes in peri-implant bone density. Int J Oral Maxillofac Implants. 1991;6(2):160-6.


