Cytocompatibility Evaluation of Etched Zirconia Ceramics Using Human Osteoblast-Like MG 63 Cells

초록
본 연구는 통상적으로 사용하는 티타늄에서 산 처리를 하였을 때 거친 면을 형성함으로써 골모세포의 활성을 증가시킨다는 연구들을 근거로 니오 비움 옥사이드 (Nb2O5)가 첨가된 (Y, Nb)-TZP에 1.5시간, 2시간, 2.5시간 산 처리를 한 군과 산 처리를 하지 않은 군에서 표면특성 및 골모유사세포 (osteoblast-like MG 63 cells)의 세포 반응을 연구하였다. 산 처리되지 않은 (Y, Nb)-TZP와 산 처리된 (Y, Nb)-TZP의 표면특성은 주사전자현미경, 엑스선 회절분석, 광학 형상측정법을 통해 평가하였고, 골모유사세포의 세포 활성도를 관찰하기 위해서는 세포부착양상, 세포증식 및 Alkaline phosphatase 활성도를 염색하여 비교 관찰하였다. 본 연구결과 엑스선 회절분석에서 불산/질산 혼합용액에 지르코니아 시편을 산 처리한 후에도 대부분이 정방정계인 구조적 안정성을 나타내었고, 세포 활성도 분석은 생존력, 세포독성인 측면에서 (Y, Nb)-TZP가 적합한 기질임을 시사했다. 그러므로, 이 연구에서는 Y-TZP의 저온열화현상에 대한 보상으로 니오비움옥사이드 (Nb2O5)를 안정화제로 사용함으로써, 적절한 시간 동안 산 처리를 한 (Y, Nb)-TZP는 골모유사세포 (MG 63)의 증식과 초기 분화를 위한 적절한 기질로 사료된다.
키워드:
지르코니아, 산 처리, 골모유사세포Ⅰ. INTRODUCTION
Tooth-colored, biocompatible ceramic materials have been introduced as a possible candidate for implants. In the 1980s, an implant was made of aluminum oxide (Al2O3). It was later withdrawn from the market owing to its high clinical fracture risk (Schulte W. 1984). Because of this critical weakness, tooth-colored zirconia have been suggested as an alternative materials in esthetically focused implant treatment (Kohal RJ et al. 2004).
In the 1970s, Garvie et al. and Gupta et al. reported that the fracture toughness of zirconia increased by tetragonal to monoclinic martensitic transformation toughening, which was considered revolutionary in the field of ceramics. Pure zirconia exists in three phase, namely, monoclinic, tetragonal, and cubic, depending on the temperature. Upon cooling from high temperature, a reverse transformation, which is accompanied by a substantial increase in volume (∼4.5%), from the tetragonal phase to monoclinic phase begins at approximately 950℃. This phenomenon can cause catastrophic failure. The increasing volume of zirconia via phase transformation can be stabilized at room temperature by the addition of oxides such as CaO, MgO, Y2O3 or CeO2 (Kelly JR & Denry I, 2008). Yttria (Y2O3) is used as a general stabilizer for maintaining the tetragonal phase of zirconia (zirconium dioxide, ZrO2) at room temperature. Using yttria (Y2O3) as a stabilizer, partially stabilized yttria tetragonal zirconia polycrystals (Y-TZP) possessed high fracture resistance owing to their energy absorption properties during the martensitic phase transformation (Lin JD & Duh JG, 2002). Zirconia ceramics have good mechanical properties such as high fracture toughness (900-1200 MPa), hardness (1200 Vickers), low thermal conductivity, and excellent resistance to corrosion (Piconi C & Maccauro G, 1999). However, the use of Y-TZP at low temperature (100-400℃) is limited by the low temperatures degradation (LTD, often referred to as “aging”). In 1981, Kobayashi et al. reported that partially stabilized zirconia polycrystals (PSZ) in a 250℃, wet environment was susceptible to LTD owing to deterioration in the mechanical properties. The speed of LTD of zirconia increased in the presence of water, and the consequences of this aging process are surface degradation with grain particle away, microcracks, and strength degradation (Swab JJ, 1991). Since LTD rapidly progresses at ∼250℃, it was not initially regarded as an issue under the physiologic conditions in the body. Nevertheless, some failures in its clinical use in hip joints were reported (Maccauro G et al. 2004). Similarly, the oral cavity is a moist and dynamic environment that can adversely affect the mechanical properties of zirconia.
There have been efforts to prevent deterioration of zirconia as a result of LTD, including the addition of stabilizers such as niobium oxide (Nb2O5) (Kim DJ et al. 1995). Such attempts led to stable lattices and low oxygen vacancy concentrations in (Y, Nb)-TZP, resulting in phase stability of tetragonal zirconia (Raghavan S et al. 2001). The substitution of Nb5+ for Zr4+ annihilates the oxygen vacancies formed by the Y3+ substitution, which reduces vacancy diffusion. Kim et al. (Kim DJ & Jung HJ, 1998) reported that 3Y-TZP doping with niobium oxide (Nb2O5) increased fracture toughness and decreased ionic conductivity, resulting in low temperature phase stability.
Based on these observations, we used 3Y-TZP co-doped with Nb2O5 in order to overcome the limitations of zirconia, which is vulnerable to LTD. Acid-etching method to increase surface roughness of zirconia is selected in our study. Zirconia has been shown to be as biocompatible as titanium (Ichikawa Y et al. 1992). Also, zirconia implants have shown biologic responses that are similar to those induced by titanium implants in vivo studies (Gahlert M et al. 2007). Therefore, Y-TZP is considered a potential alternative material to a titanium.
Hence, we assessed the surface topographies of etched (Y, Nb)-TZP and cytocompatibility of acid etching (Y, Nb)-TZP by evaluating cell attachment and proliferation and initial differentiation using human osteoblast-like MG 63 cells.
Ⅱ. MATERLALS AND METHOD
1. Preparation of specimen
Zirconia discs of Y-TZP co-doped with niobium oxide (Nb2O5), denoted (Y,Nb)-TZP, were prepared with a diameter of 12 mm and a thickness of 1.5 mm. For the preparation of (Y, Nb)-TZP, powders of 90.24 mol% ZrO2, 5.31 mol% Y2O3, and 4.45 mol% of Nb2O5 were mixed. Disc-shaped compacts were prepared by cold isostatic press of the powder mixtures at 200 MPa and then sintered for 5 h at 1650℃ in air. One group had a machined surfaces (untreated Zr group). Zirconia specimens of each experimental group were processed in HF/H2NO3 solution for a set length of time at a room temperature. Specimens were rinsed twice in absolute alcohol and once in demineralized water in an ultrasonic machine. Then, sterilization was done by ethylene oxide gas and gamma irradiation for testing.
The experimental groups were as follows:
UntreatedZr group : untreated (Y, Nb)-TZP specimen
Zr 1.5 h group : (Y, Nb)-TZP specimen processed in HF/H2NO3 solution for 1.5 h
Zr 2.0 h group : (Y, Nb)-TZP specimen processed in HF/H2NO3 solution for 2 h
Zr 2.5 h group : (Y, Nb)-TZP specimen processed in HF/H2NO3 solution for 2.5 h
2. Surface characterization
The specimens were uniformly coated with a layer of Pt-Pd alloy for electric conductivity and then the morphology of the specimen was observed by scanning electron microscopy (S-4200, Hitachi, Tokyo, Japan). The surface roughness was measured using an Wyko NT 8000 optical profilometry (Veeco, Tucson, AZ, USA) over an area of 320 μm × 240 μm (n = 4). The parameters of surface roughness in this study were the arithmetic average height (Ra), root mean square height (Rq), maximum height (Rt). The parameters were measured at three locations selected at random on the surface of the zirconia specimens.
Micro-structural characterization was analyzed by X-ray diffractometry (XRD; X’pert-APD, Philips, Almelo, Netherlands) with Cu Kα radiation. The scanning range (2θ) was from 10 to 60 degrees, covering the positions of the highest peaks of the tetragonal and monoclinic phases of zirconia (zirconium dioxide, ZrO2).
3. Cell cultivation
Human osteoblast-like MG 63 cells were cultured using Dulbecco’s modified Eagle’s medium (DMEM, Gibco BRL Life Technologies, Grand Island, NY, USA) supplemented with 10% fetal bovine serum (Gibco BRL Life Technologies, Grand Island, NY, USA), 500 units/mL penicillin (Keunhwa Pharmaceutical, Seoul, Korea), and 500 units/mL streptomycin (DongA Pharmaceutical, Seoul, Korea) in a 3 7℃ humidified incubator with 5% CO2. The medium was changed every other day. Cells were passaged using 0.05% trypsin/0.02% EDTA after confluence. For osteogenic differentiation, 2 × 10⁴ MG 63 cells plated on the zirconia specimens in 24-well plates were stimulated with 50 μg/mL L-ascorbic acid (Sigma), 10 mM beta-glycerophosphate (Sigma), and 100 nM dexamethasone (Sigma).
4. Cell morphology
Human osteoblast-like MG 63 cells were plated on zirconia specimens (4 × 10⁴ cells/well in 24-well plates) and cultured for 6 h and 24 h. Then the cells were pre-fixed in 0.5% glutaraldehyde for 1 h and post-fixed in 1% osmium tetroxide for 1 h, followed by critical-point drying (Freeze dryer, Model ES 300, Hitachi, Japan) and sputter coating with Pt-Pd (Ion Sputter, Model E-1030, Hitachi, Japan). The morphology of the cells on the specimens was examined using a scanning electron microscope (S-4200, Hitachi, Japan).
5. Cell proliferation
Cell proliferation was assessed using the CCK-8 (Cell Counting kit-8, Dojindo Molecular Technologies, Tokyo, Japan) tetrazolium salt-based assay. Human osteoblast-like MG 63 cells were grown on specimens in 24-well plates (2 × 10⁴ cells/well) for 5 d. After washing with PBS, cells were incubated with 1 mL of CCK-8 solution for 1.5 h at 37℃. Water-soluble tetrazolium salts (WST-8) were reduced by dehydrogenase in the cells to give an orange-colored product (formazan), which is soluble in the tissue culture medium. The formation of formazan dye, which is directly proportional to the number of live cells was determined by measuring the absorbance a wavelength of 450 nm by using an Epoch spectrophotometer (Biotek, Winooski, VT).
6. Alkaline phosphatase staining
Human osteoblast-like MG 63 cells seeded onto zirconia specimens in 24-well plates (2 × 10⁴ cells/well) were incubated with 50 μg/mL L-ascorbic acid (Sigma), 10 mM β-glycerophosphate (Sigma), and 100 nM dexamethasone (Sigma) for 7 d and 14 d. After fixation using 3.7% formaldehyde solution, cells were stained for the alkaline phosphatase (ALP) activity using an ALP kit (Sigma) and observed under a DM IL LED inverted-phase contrast microscope (10×/0.22 HI PLAN I objective lens; Leica Microsystems, Wetzlar, Germany) equipped with a digital camera. Images were obtained using LAS EZ software (ver. 2.1; Leica Microsystems). The staining density was quantified using the Image J program (http://rsbweb.nih.gov/ij/).
7. Statistical analysis
All experiments were performed in three replications. SPSS software (SPSS 17.0 KO, SPSS Inc, Chicago, IL, USA) was used to carry out the statistical analyses. One-way ANOVA was performed for determination of differences with the Student-Newman-Keuls test as a post hoc test among the tested groups. A value of P < 0.05 was considered statistically significant.
Ⅲ. RESULTS
1. Surface characteristics
The surface morphologies and topographical images of the investigated specimen were observed using SEM (Fig. 1). The specimens of the untreated Zr group showed polygonal grains of varying radii were observed and no porosity. The surfaces of the Zr 1.5 h group showed varying sizes of polygonal grains and minuscule gaps between the grains. The surfaces of the Zr 2.0 h group showed sharp grains and porosity inside the grains. The surfaces of the Zr 2.5 h group showed irregular, sharp grains. The surfaces were not smooth, and deeper porosity and more irregular grains were observed for this group than for the Zr 2.0 h group.
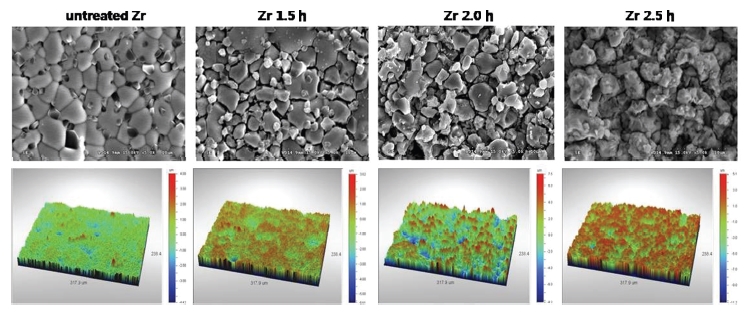
SEM and topographical measurement images by non-contact optical profilometry Of untreated Zr, Zr 1.5 h, Zr 2.0 h and Zr 2.5 h groups (at ×5000 magnification).
The surface roughness values were measured at a micron-scale by using optical profilometry (Table 1). The Ra values for the untreated Zr, Zr 1.5 h, Zr 2.0 h and Zr 2.5 h groups were 0.36, 0.55, 1.22 and 1.01 μm, respectively.
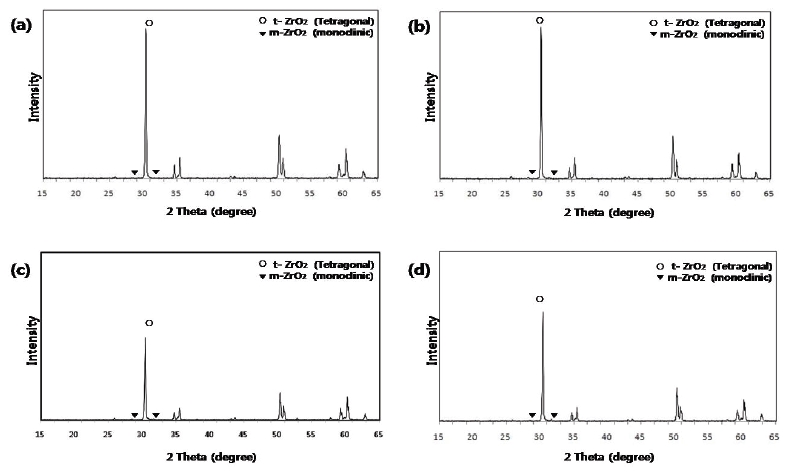
In XRD analysis, a high intensity tetragonal phase peak at 30.2° was dominant in the (Y, Nb)-TZP specimens of all the groups. The intensities of monoclinic phase peaks at 28.2° and 31.5° were minimal in all groups (Fig. 2).
2. Cell morphology
The morphology of cell attachment and the spreading of human osteoblast-like MG 63 cell on different specimens were observed using SEM at 6 h and 24 h of incubation (Fig. 3).
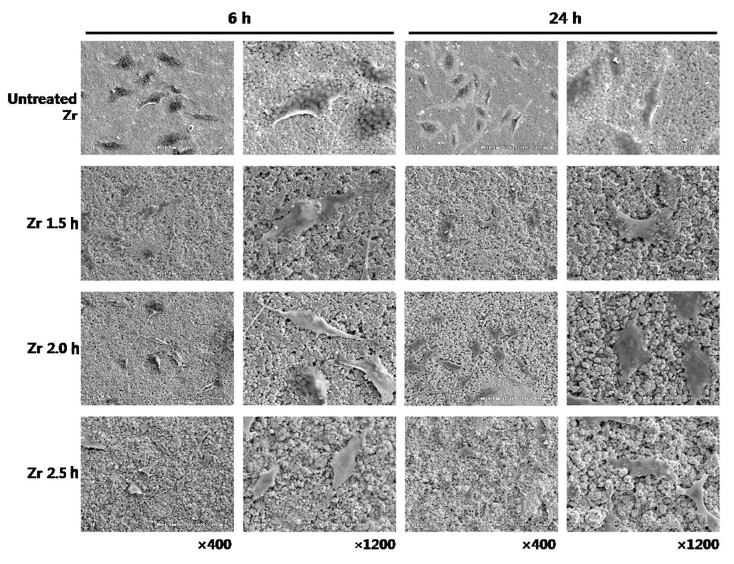
SEM images showing the morphology of attachment and spread of osteoblast-like MG 63 cells on untreated Zr, Zr 1.5 h, Zr 2.0 h and Zr 2.5 h groups at 6 h and 24 h of incubation.
After culturing for 6 h, SEM showed that the cells were in the process of adhering onto the surfaces of all the groups.
After culturing for 24 h, most cells of all groups exhibited a flattened shape, that is, cells started to spread onto all specimens. The cells of different specimens often appeared to be in contact with each other via extensions.
3. Cell proliferation
A cell proliferation assay (CCK-8 assay) of human osteoblast-like MG 63 cells seeded onto the zirconia specimens was performed for 1, 2, 3, 4, and 5 d(Fig. 4).
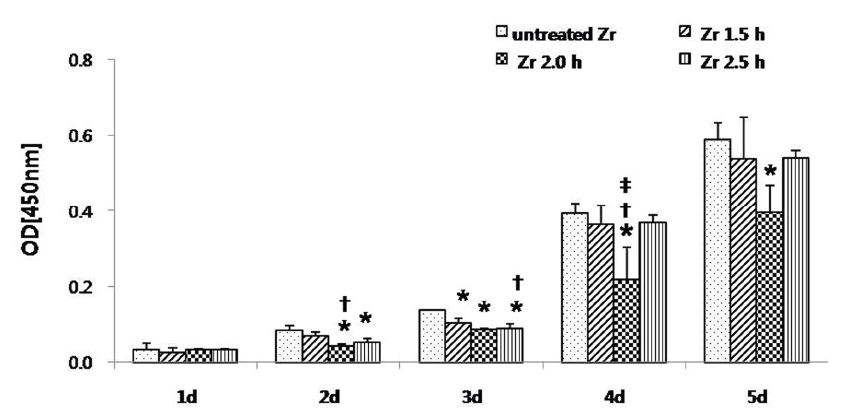
Cell proliferation assay (CCK-8 assay) of osteoblast-like MG63 cells seeded onto zirconia specimen for 5 d. The optical density (OD) for each well was measured after 90 min from the initiation of CCK-8 reaction at 450 nm by using a 96-well plate reader. The results are presented as mean ± standard deviation (N = 3).*: Statistically significant differences as compared to untreated Zr (P < 0.05).†: Statistically significant differences as compared to Zr 1.5 h (P < 0.05).‡: Statistically significant differences as compared to Zr 2.5 h (P < 0.05).
The optical densities of all the groups were enhanced up to 5 d. At 5 d, optical density of the untreated Zr group was higher than that of the other experimental groups. On day 1, the optical density among the groups was statistically insignificant (P > 0.05). On day 2, the optical density of the untreated Zr group was statistically significant (P < 0.05), as compared to Zr 2.0 h and Zr 2.5 h groups. Also, the difference between the Zr 1.5 h and Zr 2.0 h groups was statistically significant (P < 0.05). On day 3, the optical density of the untreated Zr group was statistically significant (P < 0.05), as compared to Zr 1.5 h, Zr 2.0 h, and Zr 2.5 h groups. Also, the difference between Zr 1.5 h and Zr 2.5 h groups was statistically significant (P < 0.05). On day 4, the optical density of the Zr 2.0 h group was statistically significantly (P < 0.05) lower than that of any other groups and no statistical differences were observed among the other groups except the Zr 2.0 h group (P > 0.05). On day 5, only the difference between the untreated Zr group and the Zr 2.0 h group was statistically significant (P < 0.05).
4. Alkaline phosphatase activity
Detection of ALP was performed using an ALP kit (Sigma) and the quantitative analysis of ALP staining density was accomplished using the Image J program at 7 and 14 d (Figs. 5a and 5b).
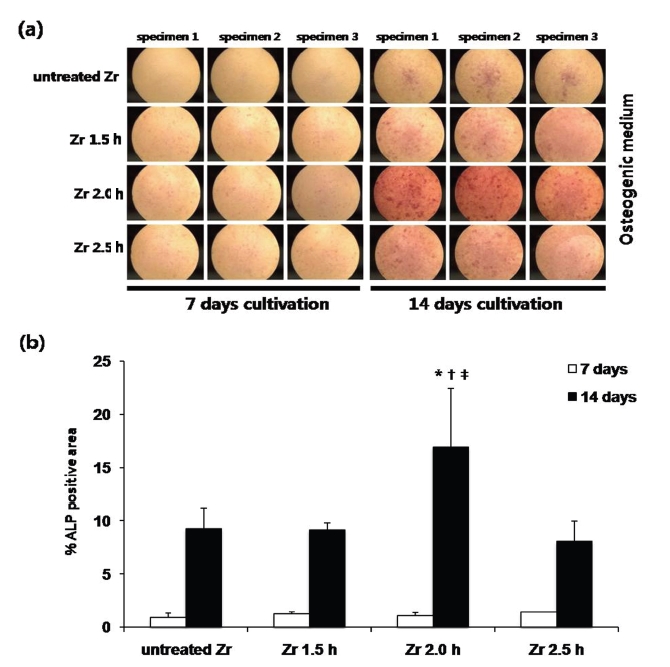
(a) Photographs showing staining density on ALP activity. MG 63 cells were stained for alkaline phosphatase (ALP) activity using an ALP kit (Sigma). Cells were cultured in osteogenic medium for 7 and 14 d. (b) Quantitative analysis of ALP staining density of MG 63 cells cultured on different groups at 7 and 14 d. The staining density was quantified using the Image J program. The results are presented as mean ± standard deviation (N = 3) .* Statistically significant differences as compared to untreated Zr (P < 0.05).†: Statistically significant differences compared to Zr 1.5 h (P < 0.05).‡: Statistically significant differences compared to Zr 2.5 h (P < 0.05).
At 7 d, differences of ALP staining density was not statistically significant (P > 0.05). At 14 d, the cells grown on the Zr 2.0 h group exhibited significantly higher ALP staining density than those on other groups (P < 0.05). Among others groups, the difference of ALP staining density were not statistically significant (P > 0.05).
Ⅳ. DISCUSSION
For analyzing the surface characteristics of (Y, Nb)-TZP specimens, SEM observation, surface roughness measurements, and XRD analysis were performed. With acid etching, minute gaps at grain boundaries started to form, and grains with rough surfaces and porosity between grains appeared in the SEM images . In our study, the surface roughness (Ra) measured by optical profilometry was 1.22 μm in the Zr 2.0 h group and 1.01 μm in the Zr 2.5 h group. In a previous in vitro study, the Sa value of zirconia discs etched in solutions of sodium hydroxide and potassium hydroxide for 30 h was 1.19 μm (Hempel U et al. 2010). In another in vitro study, the Ra value of Y-TZP abraded by air-borne particles and additionally acid etched with hydrofluoric acid for 5 minutes was 0.93 μm (Bächle M et al. 2007). Although we used a different approach for improving the surface properties, the profilometric measurements were similar. Hence, it was considered that etching of (Y, Nb)-TZP in a HF/H2NO3 solution is one of the ways to modify surface topographies.
The micro-structural characterization of (Y, Nb)-TZP was carried out using XRD analysis. Zirconium dioxide (ZrO2) in Y-TZP exists in a tetragonal phase at room temperature, which contributes to the structural stability of Y-TZP by transformation toughening. In our study, XRD analysis of the (Y, Nb)-TZP specimen showed a high intensity tetragonal peak at 30.2°. The intensities of monoclinic phase peaks at 28.2° and 31.5° were minimal. With increasing acid-etching time, the XRD patterns of all experimental groups were similar to that of the untreated (Y, Nb)-TZP. These results indicate that use of the acid-etching method for modifying surface topographies did not adversely affect the phase stability of (Y, Nb)-TZP.
SEM observation of the cells after culturing for 6 h showed that the cells in all groups were in the process of adhesion. Furthermore, the cells of all groups after culturing for 6 h and 24 h demonstrated a similar morphologic appearance: partially spread onto the specimens and a flattened shape. Grinell (1978) reported that adhesion of cells to substrates followed a particular sequence of steps, that is, adsorption of serum proteins, contact of the rounded cell with the substrate, cell attachment to the substrate, and cell spreading on the substrate. In the present study, we did not analyze the early steps of osteoblast attachment onto zirconia ceramics. However, we observed close contact between the cells on the zirconia ceramics and flattened cells on the zirconia ceramics in SEM. These observations in the present study correspond with those in a previous study, which demonstrate that MC3T3-E1 cells on all the plates in the study appeared to attach and spread well after 6 h and 24 h incubation on the rough and smooth surfaces of Y-TZP (Ra 1.01 μm vs. 0.18 μm) (Yamashita D et al. 2009).
Cell proliferation was observed every day for 5 days in each group, and staining of MG 63 cells for ALP activity was observed under a phase-contrast microscope. Quantitative analysis was then performed using the Image J program. Optical density, which was determined using the CCK-8 assay, tended to increase in each group over 5 d. However, on day 1, the optical density of the osteoblast-like MG 63 cells was higher in the Zr 2.0 h group. On day 4, the optical density of the Zr 2.0 h group was significantly lower than that of the other groups (P < 0.05). However, the ALP staining density was the highest in the Zr 2.0 h group at 14 d (P < 0.05).
Stein et al. (1990) proposed a model of the relationship between proliferation and differentiation during the initial period of the development of a rat osteoblast. This relationship had an osteoblast developmental sequence with three distinct periods: proliferation, extracellular matrix maturation, and mineralization (Lian JB & Stein GS, 1992). Considering our results for the Zr 2.0 h group, although cell proliferation was relatively low, this group showed the highest ALP staining density, which is consistent with Stein’s model, in which proliferation is down-regulated by maturation of the extracellular matrix (ECM) and induction of ALP was initiated at the end of proliferation. ALP is an early differentiation marker for osteoblasts, and it supplies the cell with inorganic phosphate for subsequent calcium phosphate accumulation. The phosphate, which is released from β-glycerophosphate by ALP, is necessary for the formation of calcium phosphate nodules around osteoblasts in vitro.
The effect of increasing surface roughness on the cellular response of osteoblast has not concluded (Lincks J et al. 1998, Cooper LF et al. 1999). In a previous in vitro study, cell attachment and proliferation on Ti disks decreased on rough surfaces in comparison with smooth surfaces (Boyan BD et al. 2003). However, in another in vitro study, it was reported that the number of attached osteoblasts on rough surfaced titanium was higher than that on smooth surfaced titanium (Pae A et al. 2011).
Since Y-TZP has been introduced as an alternative biomaterial to Ti implants, the role of the zirconia surface topography on the response of osteoblasts has been the focus of several in vitro studies in recent years. In one in vitro study, it was demonstrated that zirconia with two different topographical surfaces (sandblasted vs. etched: Sa 1.13 μm vs. 1.11 μm) has a more pronounced effect on the adhesion, proliferation, and differentiation of the cells, compared with titanium and that topographical differences of zirconia have a minor effects on osteoblast biology (Hempel U et al. 2010). In another in vitro study, roughened Y-TZP (sandblasted vs. sandblasted/etched: Ra 0.85 μm vs. 0.93 μm) was found to be an appropriate substrate for the proliferation and spreading of osteoblastic cells (Bächle M et al. 2007). According to the majority of studies, surfaces with an Sa of ≥1 μm are considered rough, whereas those with an Sa of ≤1 μm are described as smooth, with the average surface roughness of titanium (Sykaras N et al. 2000). In this present study, the roughness value of (Y, Nb)-TZP after acid-etching over time ranged from 0.55 μm to 1.22 μm. Although the current results are different from the SEM image of SLA (sandblast, large grit, acid-etching) surface roughness, which shows a waviness by the sandblasting and micro-roughness by the acid-etching in titanium, the roughness values of (Y, Nb)-TZP after acid-etching for 1.5 h, 2.0 h and 2.5 h was 0.55 μm, 1.22 μm and 1.01 μm, respectively. The roughness value of (Y, Nb)-TZP with the untreated Zr group was 0.36 μm. On day 5, the optical density of the untreated Zr group was significantly higher than that of the Zr 2.0 h group (P < 0.05); the optical density of the other groups were not statistically significant as compared to the untreated Zr group (P > 0.05). Cellular proliferation of the Zr 2.0 h group with an Ra value of 1.22 μm was somewhat lower than that of the other groups at 5 d, but the staining density of ALP, an early differentiation marker of osteoblast, was significantly higher than that of the other groups (P < 0.05) at 14 d. It suggests that the rough surface of Zr 2.0 h group may stimulate the ALP activity causing by down regulation of proliferation in human osteoblast-like MG 63 cells. Thus the increase of ALP activity means initiation of cellular differentiation (Lian JB & Stein GS, 1992)
On the basis of our results, we postulate that staining density of ALP is relative low by stage of proliferation up to 7 days, since then ECM maturation contribute to down-regulate of proliferation and staining density of ALP, early differentiation marker, was remarkably higher in the Zr 2.0 h group at 14 days. Hence, roughened (Y, Nb)-TZP showed higher staining density of ALP than relatively smooth (Y, Nb)-TZP.
Ⅴ. CONCLUSION
This in vitro study evaluated the response of osteoblast cells on etched (Y, Nb)-TZP specimens. XRD analysis showed the structural stability of the dominant tetragonal phase after acid-etching zirconia ceramics in a HF/H2NO3 solution. Using niobium oxide as a stabilizer compensate for the LTD of Y-TZP, (Y,Nb)-TZP with adequate etch times served appropriate substrates for the proliferation and initial differentiation of osteoblast cells in the present study.
References
-
Bächle, M, Butz, F, Hübner, U, Bakalinis, E, Kohal, RJ, (2007), Behavior of CAL72 osteoblast-like cells cultured on zirconia ceramics with different surface topographies, Clin Oral Implants Res, 18, p53-59.
[https://doi.org/10.1111/j.1600-0501.2006.01292.x]

-
Boyan, BD, Lossdörfer, S, Wang, L, Zhao, G, Lohmann, CH, Cochran, DL, et al , (2003), Osteoblsts generate an osteogenic microenvironment when grown on surfaces with rough microtopographies, Eur Cell Mater, 6, p22-27.
[https://doi.org/10.22203/eCM.v006a03]

- Cooper, LF, Masuda, T, Whitson, SW, Yliheikkil, P, David, A, (1999), Formation of mineralizing osteoblast cultures on machined, titanium oxide grit-blasted and plasma-sprayed titianium surfaces, IntJ Oral Maxillofac Implants, 14, p37-47.
-
Gahlert, M, Gudehus, T, Eichhorn, S, Steinhauser, E, Kniha, H, Erhardt, W, (2007), Biomechanical and histomorphometric comparison between zirconia implant with varying surface textures and a titanium implant in the maxilla of miniature pigs, Clin Oral Implants Res, 18, p662-668.
[https://doi.org/10.1111/j.1600-0501.2007.01401.x]

-
Garvie, RC, Hannink, RH, Pascoe, RT, (1975), Ceramic steel?, Nature, 258, p703-704.
[https://doi.org/10.1038/258703a0]

-
Grinell, F, (1978), Cellular adhesiveness and extracellular substrata, Int Rev Cytol, 53, p65-129.
[https://doi.org/10.1016/S0074-7696(08)62241-X]

-
Gupta, TK, Lange, FF, Bechtold, JH, (1978), Effect of stress-induced phase transformation on the properties of polycrystalline zirconia containing metastable tetragonal phase, J Mater Sci, 13, p1464-1470.
[https://doi.org/10.1007/BF00553200]

-
Hempel, U, Hefti, T, Kalbacova, M, Wolf-Brandstetter, C, Dieter, P, Schlottig, F, (2010), Response of osteoblst-like SAOS-2 cells to zirconia ceramics with different surface topographies, Clin Oral Implants Res, 21, p174-181.
[https://doi.org/10.1111/j.1600-0501.2009.01797.x]

-
Ichikawa, Y, Akagawa, Y, Nikai, H, Tsuru, H, (1992), Tissue compatibility and stability of a new zirconia ceramic in vivo, J Prosthet Dent, 68, p322-326.
[https://doi.org/10.1016/0022-3913(92)90338-B]

-
Kelly, JR, Denry, I>, (2008), Stabilized zirconia as a structural ceramic: an overview, Dent Mater, 24, p289-298.
[https://doi.org/10.1016/j.dental.2007.05.005]

-
Kim, DJ, Jung, HJ, Cho, DH, (1995), Phase transforamtion of Y2O3 and Nb2O5 doped tetragonal zirconia during low temperature aging in air, Solid State Ionics, 80, p67-73.
[https://doi.org/10.1016/0167-2738(95)00115-M]

-
Kim, DJ, Jung, HJ, (1998), Fracture toughness, ionic conductivity, and low-temperature phase stability of tetragonal zirconia codoped with yttria and niobium oxide, J Am Ceram Soc, 81, p2309-2314.
[https://doi.org/10.1111/j.1151-2916.1998.tb02626.x]

-
Kobayashi, K, Kuwajima, H, Masaki, T, (1981), Phase change and mechanical properties of ZrO2–Y2O3 solid electrolyte after Aging, Solid State Ionics, 3/4, p489-493.
[https://doi.org/10.1016/0167-2738(81)90138-7]

-
Kohal, RJ, Weng, D, Bachle, M, Strub, JR, (2004), Loaded custom-made Zirconia and titanium implants show similar osseointegration: an animal experiment, J Periodontol, 75, p1262-1268.
[https://doi.org/10.1902/jop.2004.75.9.1262]

-
Lian, JB, Stein, GS, (1992), Concepts of osteoblast growth and differentiation : basis for modulation of bone cell development and tissue formation, Crit Rev Oral Biol Med, 3, p269-305.
[https://doi.org/10.1177/10454411920030030501]

-
Lin, JD, Duh, JG, (2002), Fracture toughness and hardness of ceria and yttria-doped tetragonal zirconia ceramics, Mater Chem Phys, 78, p253-261.
[https://doi.org/10.1016/S0254-0584(02)00327-9]

- Lincks, J, Boyan, BD, Blanchard, CR, Lohmam, CH, Liu, Y, Cochran, DL, et al , (1998), Response of MG 63 osteoblast-like cells to titanium and titanium alloy is dependent on surface roughness and composition, Biomaterials, 19, p2219-2232.
-
Maccauro, G, Piconi, C, Burger, W, Pilloni, L, De Santis, E, Muratori, F, et al , (2004), Fracture of a Y-TZP ceramic femoral head. Analysis of a fault, J Bone Joint Surg Br, 86, p1192-1196.
[https://doi.org/10.1302/0301-620X.86B8.15012]

- Pae, A, Kim, SS, Kim, HS, Woo, YH, (2011), Osteoblast-like cell attachment and proliferation on turned, blasted, and anodized titanium surfaces, Int J Oral Maxillofac Implants, 26, p475-481.
-
Piconi, C, Maccauro, G, (1999), Zirconia as a ceramic biomaterial, Biomaterials, 20, p1-25.
[https://doi.org/10.1016/S0142-9612(98)00010-6]

-
Raghavan, S, Wang, H, Porter, WD, Dinwiddie, RB, Mayo, MJ, (2001), Thermal Properties of zirconia co-doped with trivalent and pentavalent oxides, Acta Mater, 49, p169-179.
[https://doi.org/10.1016/S1359-6454(00)00295-0]

- Schulte, W, (1984), The intra-osseous Al2O3 (Frialit) Tuebingen implant. Developmental status after eight years (Ⅰ-Ⅲ), Quintessence Int, 15, p1-39.
- Stein, GS, Lian, JB, Owen, TA, (1990), Relationship of cell growth to the regulation of tissue-specific gene expression during osteoblast differentiation, FASEB J, 4, p3111-3123.
-
Swab, JJ, (1991), Low temperature degradation of Y-TZP materials, J Mater Sci, 26, p6706-6714.
[https://doi.org/10.1007/BF02402664]

- Sykaras, N, Iacopino, AM, Marker, VA, Triplett, RG, Woody, RD, (2000), Implant materials, designs, and surface topographies: their effect on osseointegration. A literature review, IntJ Oral Maxillofac Implants, 15, p675-690.
-
Yamashita, D, Machigashira, M, Miyamoto, M, Takeuchi, H, Noguchi, K, Izumi, Y, et al , (2009), Effect of surface roughness on initial responses of osteoblast-like cells on two types of zirconia, Dent Mater J, 28, p461-470.
[https://doi.org/10.4012/dmj.28.461]


