An evaluation of degradation of two self-etch bonding agents
본 연구에서는 2종의 자가부식 접착제(Clearfil SE Bond, AdheSE)의 온도에 의한 열화를 평가하였다. 각 접착제로부터 5개의 필름을 만들고 그 필름들을 4°C와 37°C의 물에 보관한 후 0, 3, 10, 30, 60일에 꺼내어 ATR-FTIR 측정을 수행하였다. 흡수강도(absorbance intensities, AI) 피크의 비율은 유의하게 변하지 않았지만(P > 0.05), C=O 영역, 즉 1714 cm-1에서의 변화는 복잡한 산화(oxidation)와 에스테르화(esterification)를 시사하였다. 또한 Clearfil SE Bond가 AdheSE보다 안정적인 것으로 나타났다.
Keywords:
FITR spectroscopy, Bonding agent, DegradationINTRODUCTION
Resin-based materials are widely used in restorative dentistry. Their long-term clinical performance is frequently correlated with degradation characteristic, as there can directly affect their mechanical properties (Geurtsen, 1998). Adhesion of dental resins to enamel and dentin has progressed dramatically in the 40 years since Buonocore introduced the technique of etching enamel with phosphoric acid to improve the adhesion of resin fillings to enamel.
The ultimate goal of a dental bonding system is to achieve a good and durable bond to the dental substrates. However, contemporary dentin adhesives contain increased concentration of hydrophilic resin monomers to enhance their bonding to the intrinsically wet dentine substrate (Ferracane, 2006). The hydrophilic nature of ionic and acidic methacrylate copolymers facilitates water sorption from the oral environment when exposed externally to salivary fluids and internally from the underlying hydrated dentine (Yiu et al., 2006). In addition, the materials are exposed to exogenous substances that contain a variety of chemicals, including acids, bases, salts, alcohols, oxygen, etc. that enter the oral environment during eating and drinking. The chemistry and duration of exposure are important determinants of what if any influence a molecule may have on the material’s polymer network (Ferracane, 2006).
For most degradation materials, passive hydrolysis is the most important mode of degradation (Bagheri et al., 2007). There are several factors that influence the velocity of this reaction: the type of chemical bond, pH, copolymer composition, water uptake and temperature (Göpferich, 1996). In studies of hydrolytic degradation of resin matrix, several investigation techniques have been used to correlate degradation to parameters sensitive to the developing processes. In most cases, the parameters used for monitoring degradation are change in weight, pH and bond strength (Parini and Pantani, 2007). However, these methods could not clearly monitor the changes that the sample undergoes during degradation, and the degradation of bonding agent is often neglected by researchers.
The advantages of infrared spectrometry in determining chemical and structural information are well known. It is considered as a useful tool in the analysis of various materials and it is a complementary technique for microstructural characterization (Mueller and Freeman, 1995). And the Fourier transform infrared–attenuated total reflectance (FTIR-ATR) technique is particularly useful for surface analysis of many materials due to its ability in analyzing the samples independent of their thickness and, it more surface sensitive than FTIR. However, it is not widely used for the analysis of the degradation mechanism of adhesive until now. The objective of this study was to evaluate the FTIR-ATR spectral changes of two adhesive bonding agents in order to determine the mechanism of degradation at different temperature over a storage period of 60 days.
MATERIALS AND METHODS
In this study, two adhesive bonding agents were evaluated: Clearfil SE Bond (CS) and AdheSE (AS). The chemical composition and batch numbers of the materials according to the manufacturer are shown in Table 1.
About two drops of SE boning agent were placed on a glass slide and spread with resin spatula. After that, another glass slide with a transparent polyester film was gently placed over it to prevent formation of the oxygen inhibited layer. The resulting layer was then light cured for 40 s using LED-Skylight (DMETEC CO., Buchon-Si, Korea). Ten specimens were made from each brand adhesives. Subsequently, the films were kept in an oven at 67°C for 3 h to evaporate water before ATR measurement.
Micro-ATR spectra were collected using an IRPrestige-21 FTIR (SHIMADZU Cor., Kyoto, Japan) and micro-ATR accessory (PIKE technologies Inc, Madison, WI, USA) equipped with ZnSe lenses. The films were placed onto the ATR crystal and spectra collected without any additional sample preparation. Two points of each film were measured. Infrared spectra in the wavelength ranges 4000-500 cm-1 were obtained with a resolution of 4 cm-1 and by co-adding 32 scans. The micrometer screw of micro-ATR was set to 2.0.
Five specimens of each material were stored in sealed glass vials containing 10 ml of distilled water at 4 °C and 37 °C. The ATR spectra tests of each film were repeated after 3, 10, 30, 60 days.
To understand the effect of storage on the structure of bonding films, ratios of the absorbance intensities (AI) of the peaks to absorbance intensity of aromatic C=C at 1606 cm-1 were calculated. Aromatic C=C bonds are considered stable in the matrix resin. The C=C bonds of benzene are stable, probably as a result of all bonding orbital which are filled and low in energy. The average of the ten ratios was calculated as baseline.
Statistic analysis of AI was performed using a two-way analysis of variation (ANOVA) evaluating the factors of storage temperature and time.
RESULTS
The ratios of the AI of major peaks to that of the aromatic C=C peak (1606 cm-1) are presented in Table 2. The two-way ANOVA shows that the AI of main peaks are not significantly influenced by the storage conditions (P > 0.05).
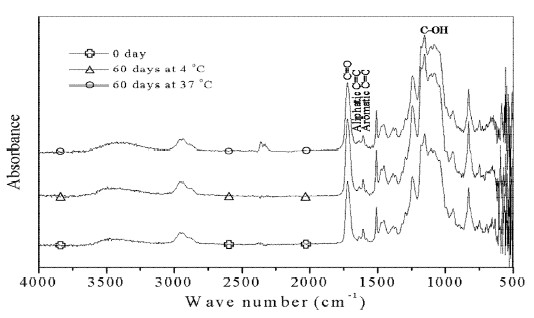
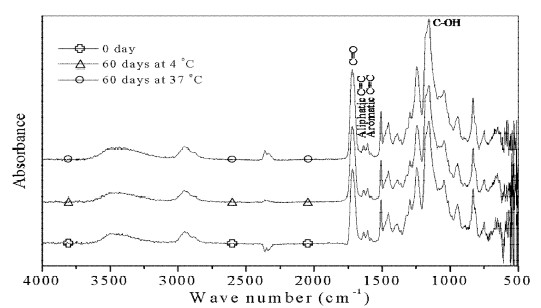
Assignments of major bands obtained by the absorbance, respective ATR spectra of bonding agents untreated and treated with distilled water are shown in Figures 1-2. The strong peak at 1720 cm -1 results from C=O stretching vibration. The peak at 1635 cm-1 is the aliphatic C=C stretching mode, while the band at 1606 cm-1 is aromatic C=C stretching mode. The band at 1155 cm-1 originates from C-OH stretching vibration.
ATR spectra (1800-1600 cm-1) of films immersed in distilled water are shown in Figure 3. For all the samples analyzed, a new peak at 1714 cm-1 (arrow) was appeared at 3 days, and nearly disappeared at 10 days. However, over 30 days, a more apparent peak for AS appeared at the same position at 4 °C and 37 °C compared to CS.
DISCUSSION
In the present study, ratios of the AI of major peaks are insignificant change for materials stored in distilled water at 4 °C or 37 °C for all testing periods, which confirms earlier results (Lee et al., 1995). Further, the main bands in Figures. 1-2 also didn’t show apparent spectral changes. These are accordance with the bond strength results. The microtensile or shear bond strength was not statistically difference found even immersed in distilled water at 37 °C for 1 year (Ansari and Sadr, 2007).
However, a detailed analysis of the C=O region showed the formation of a new peak at 3 days, which is attributed to ketone and carboxylic acid. The intensity decreased at 10 days and increasd again with time over 10 days. The course can be correlated with oxidation and esterification. The degradation processes are shown in Figure 4.
It has been described that oxygen can interact with the methacrylate group and produce formaldehyde (Oysaed et al., (1988). The formaldehyde released course causes the ketone C=O increased (Figure 4A). While the ester hydrolysis course forces the carbonyl of ester and ketone decreased (Figure 4B), and further hydrolysis (Figure 4C) causes the carbonyl of acid increased and carboxyl of ester decreased. According to Oysaed et al. (1988), the highest quantities of formaldehyde were released initially and apparently decreased over 3 days. While it is well known that the hydrolysis velocity of ester is very low in water and constant on time (Parini and Pantani, 2007). So when the ketone C=O inducing rate is decreased due to the formaldehyde released quantities decreased, the peak height at 1714 cm-1 is also weaker than 3 days because of the hydrolysis of ester. And further hydrolysis forced the peak higher with time due to the carboxylic acid induced.
Although the degradation course is very complex, the peaks of C=O bond do not show apparent alteration in Figures 1-2. This is because C=O bond of ester group is heavily overlapped and separated by only a few wavenumbers (6 cm-1 in this study) with acid group and ketone group. Furthermore, the degradation quantity is very low. Oysaed et al. (1988) found only small or insignificant variations in release of formaldehyde were observed when the specimens coated with a polyester film. And the degradation ratio of ester, which immersed in water, is very slowly. Maybe the storage period is not enough long to educe the spectral change.
In this study, it is an unexpected result that the hydrolysis is not apparently influenced by temperature. Because according to the Arrhenius equation, the hydrolysis rate increases with temperature. This may be attributed that the hydrolysis rate in water is very low.
And after 60 days, the C=O peak (1714 cm-1) of AS is higher compared to CS, which means that CS is more stable compared to AS. 10-MDP is considered as a relatively hydrolysis stable monomer (Van Landuyt et al., 2007). And CS contains hydrophobic dimethacrylate monomer which can be kept water at a distance. As a consequence, CS is hydrophilic more stable compared to AS. Meanwhile it can be speculated that the degradation of matrix is dependence on the hydrophilicity of monomers. However, the light-polymerization of bonding agents when combined with that of resin composites should be further investigated to determine the clinical degree of conversion.
Acknowledgments
This research was supported by Kyungpook National University Research Fund, 2013.
References
- ZJ Ansari, AR Sadr, Effect of water storage on the micro-shear bond strength of two self-etch adhesives to enamel and dentin, Dent Mater, (2007), 4, p63-67.
-
R Bagheri, MJ Tyas, MF Burrow, Subsurface degradation of resin-based composites, Dent Mater, (2007), 23, p944-951.
[https://doi.org/10.1016/j.dental.2006.06.035]

-
JL Ferracane, Hygroscopic and hydrolytic effects in dental polymer networks, Dent Mater, (2006), 22, p211-222.
[https://doi.org/10.1016/j.dental.2005.05.005]

-
W Geurtsen, Substances released from dental resin composites and glass ionomer cements, Eur J Oral Sci, (1998), 106, p687-695.
[https://doi.org/10.1046/j.0909-8836.1998.eos10602ii04.x]

-
A Göpferich, Mechanisms of polymer degradation and erosion, Biomaterials, (1996), 17, p107-114.
[https://doi.org/10.1016/0142-9612(96)85755-3]

-
SY Lee, EH Greener, HJ Mueller, Effect of food and oral simulating fluids on structure of adhesive composite systems, J Dent, (1995), 23, p27-35.
[https://doi.org/10.1016/0300-5712(95)90657-4]

-
HJ Mueller, D Freeman, FT-IR spectrometry in materialography, Mater Charact, (1995), 35, p113-126.
[https://doi.org/10.1016/1044-5803(95)80109-X]

-
H Oysaed, IE Ruyter, IJ Sjøvik Kleven, Release of formaldehyde from dental composites, J Dent Res, (1988), 67, p1289-1294.
[https://doi.org/10.1177/00220345880670100901]

- M Parini, R Pantani, FTIR analysis of hydrolysis in aliphatic polyesters, Polymer Degrad Stab, (2007), 92, p1491-1497.
-
KL Van Landuyt, J Snauwaert, J De Munck, M Peumans, Y Yoshida, A Poitevin, E Coutinho, K Suzuki, P Lambrechts, B Van Meerbeek, Systematic review of the chemical composition of contemporary dental adhesives, Biomaterials, (2007), 28, p3757-3785.
[https://doi.org/10.1016/j.biomaterials.2007.04.044]

-
CK Yiu, NM King, MR Carrilho, S Sauro, FA Rueggeberg, C Prati, RM Carvalho, DH Pashley, FR Tay, Effect of resin hydrophilicity and temperature on water sorption of dental adhesive resins, Biomaterials, (2006), 27, p1695-1703.
[https://doi.org/10.1016/j.biomaterials.2005.09.037]


